
MATLAB: An Introduction with Applications
6th Edition
ISBN: 9781119256830
Author: Amos Gilat
Publisher: John Wiley & Sons Inc
expand_more
expand_more
format_list_bulleted
Related questions
Question
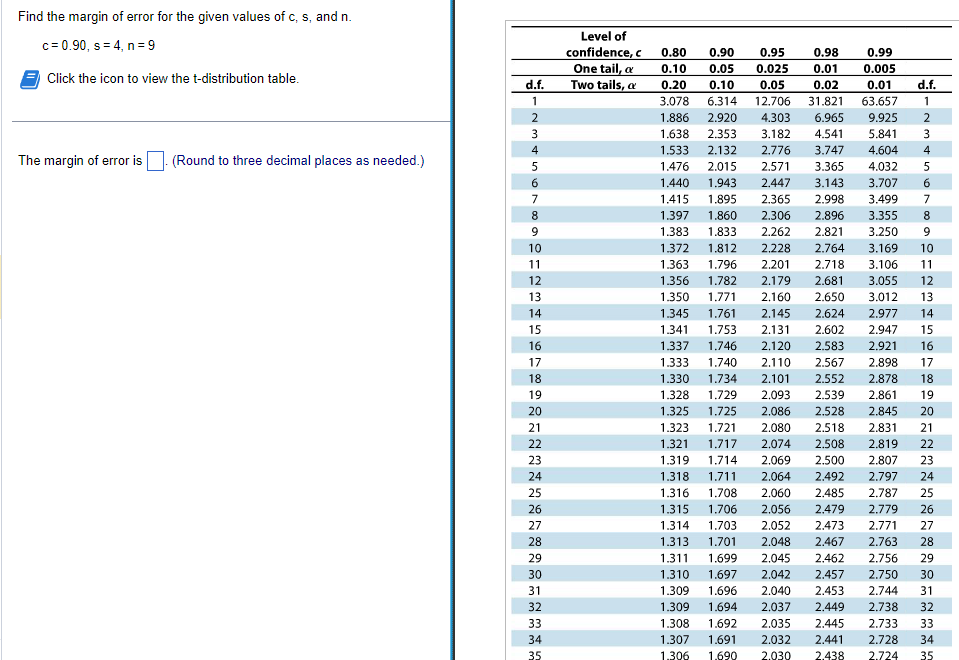

Transcribed Image Text:Find the margin of error for the given values of c, s, and n.
c= 0.90, s = 4, n=9
Click the icon to view the t-distribution table.
The margin of error is
(Round to three decimal places as needed.)
d.f.
1
2
.WN
3
4
5
6
7
8
9
10
11
12
13
14
15
16
17
18
19
20
21
22
23
24
25
26
27
28
29
30
31
32
33
34
35
Level of
confidence, c
One tail, a
Two tails, a
d.f.
0.80 0.90 0.95 0.98 0.99
0.10 0.05 0.025 0.01 0.005
0.20 0.10 0.05 0.02 0.01
3.078 6.314 12.706 31.821 63.657 1
1.886 2.920
9.925 2
1.638 2.353
4.541 5.841
4.604
4.032
4.303 6.965
3.182
2.776
2.571 3.365
1.533 2.132
3.747
1.476 2.015
1.440 1.943
2.447 3.143 3.707 6
1.895 2.365 2.998 3.499 7
1.860 2.306 2.896
3.355
1.833 2.262 2.821
1.415
1.397
1.383
1.372
8
3.250
9
3.169
10
3.106
11
12
13
14
15
16
17
1.812 2.228 2.764
1.363 1.796 2.201 2.718
1.356 1.782 2.179 2.681 3.055
1.350 1.771 2,160
2.650 3.012
1.345 1.761
2.145 2.624 2.977
1.341 1.753 2.131 2.602 2.947
1.337 1.746 2.120 2.583 2.921
1.333 1.740 2.110 2.567 2.898
1.330 1.734 2.101 2.552 2.878 18
1.328 1.729 2.093 2.539 2.861 19
1.325 1.725 2.086 2.528 2.845 20
1.323 1.721 2.080 2.518 2.831 21
1.321 1.717 2.074 2.508 2.819 22
1.319 1.714 2.069 2.500 2.807
23
1.318 1.711 2.064 2.492 2.797 24
1.316 1.708 2.060 2.485 2.787
25
1.315 1.706 2.056 2.479 2.779 26
1.314 1.703 2.052 2.473 2.771 27
1.313 1.701 2.048 2.467 2.763 28
1.311 1.699 2.045 2.462 2.756
29
1.310 1.697 2.042 2.457 2.750 30
1.309 1.696 2.040 2.453 2.744 31
1.309 1.694 2.037 2.449 2.738 32
1.308 1.692 2.035 2.445 2.733 33
1.307 1.691 2.032 2.441 2.728 34
1.306 1.690 2.030 2.438 2.724 35
N345

Transcribed Image Text:35
36
37
38
39
40
45
50
60
70
80
90
100
500
1000
30
d.f.
Level of
confidence, c
One tail, a
Two tails, a
1.306 1.690
2,030 2.438 2.724 35
1.306 1.688 2,028 2.434 2.719 36
2.026 2.431 2.715 37
2.429
1.305 1.687
1.304 1.686 2.024
2.712
38
1.304
1.685 2.023
2.426 2.708 39
1.303 1.684
2.704
40
1.301 1.679
2.690 45
2.678
50
2.660 60
2.648 70
1.990
2.374
2.639
80
1.662 1.987 2.368 2.632
2.626
2.586
2.581
2.576
2.021 2.423
2.014
2.412
1.299 1.676 2.009
1.296
1.294 1.667 1.994
1.292 1.664
2.403
1.671 2.000 2.390
2.381
1.291
1.290 1.660 1.984 2.364
1.283 1.648
1.965 2.334
1.282 1.646
1.962
2.330
1.282 1.645
1.960 2.326
0.80
0.10
0.20
0.90
0.05
0.10
0.95
0.98
0.025 0.01
0.05
0.02
0.99
0.005
0.01
90
100
500
1000
30
d.f.
Expert Solution
This question has been solved!
Explore an expertly crafted, step-by-step solution for a thorough understanding of key concepts.

This is a popular solution

Trending nowThis is a popular solution!

Step by stepSolved in 3 steps with 3 images

Knowledge Booster

Similar questions
- Find the margin of error for the given values of c, s, and n. c%3D0.95, s%3D3.6 , n 16 F Click the icon to view the t-distribution table. The margin of error is (Round to one decimal place as needed.) Get more help-arrow_forwardAssume that a randomly selected subject is given a bone density test. Bone density test scores are normally distributed with a mean of 0 and a standard deviation of 1. Draw a graph and find P, the 11th percentile. This is the bone density score separating the bottom 11% from the top 89%. Which graph represents P ? Choose the correct graph below. O A. O B. OD. P11 P11 P11 P11 The bone density score corresponding to P1 is (Round to two decimal places as needed.) Click to select your answer(s). APR tv MacBook Air F9 F10 LLA 20 F3 F6 F8 F4 F5 F1 F2 & #3 7 8. %24arrow_forwardIn the US, 46.2% of all people have type O blood, 39.1% have type A blood, 10.4% have type B blood and 4.3% have type AB blood. A researcher wants to see if the distribution of blood type is different for millionaires. The table below shows the results of a random sample of 3116 millionaires. What can be concluded at the a = 0.01 significance level? a. Complete the table by filling in the expected frequencies. Round to the nearest whole number: Frequencies of Blood Type Outcome Frequency Expected Frequency 1434 A 1224 В 310 AB 148 b. What is the correct statistical test to use? Select an answer V c. What are the null and alternative hypotheses? Но: O Blood type and income are independent. O The distribution of blood type for millionaires is not the same as it is for Americans in general. O The distribution of blood type for millionaires is the same as it is for Americans in general. O Blood type and income are dependent.arrow_forward
- Using this data, find the variance for between subjects. Round your final answer to the nearest 2 decimal places. 0 Tacos 2 Tacos 4 Tacos 8 Tacos 10 Tacos 12 Tacos Jack 52 62 75 85 91 84 Jane 53 67 71 79 91 86 Jeff 55 99 69 79 54 65 Dr. Chu decided to conduct a study on the effects of the amount of tacos eaten per week and one's score on their final exam for STATS 101. The data is presented above.arrow_forwardMake a frequency distribution for the data. X f 1 2 2 20 3 21 4 15 The sample mean is x = (Round to one decimal place as needed.)arrow_forwardCompute the SS (sum of squared deviation) for Test Scores. Round your answer to the nearest 2 decimal places. Subjects Cups of Coffee (x) Test Scores (y) A 4 91 B 2 96 C 1 75 D 9 75 E 8 68arrow_forward
- View the photo(s) of the t-distribution table attached and answer the following question. Find the margin of error for the given values of c, s, and n. c=0.99, s=5, n=26 The margin of error is?arrow_forwardk $ Let p be the population proportion for the following condition. Find the point estimates for p and q. Of 974 children surveyed, 123 plan to join the armed forces in the future. The point estimate for p, p, is (Round to three decimal places as needed.) U (Round to three decimal places as needed.) The point estimate for q, q, is J V ○ 발 C F5 30 % 5 T F6 6 ✈ Y H FZ C & N B N. JU F8 * 00 8 ... A F9 M 09 9 K F10 70°F Sunny ☀- F11 O P + 1:17 PM ^ D G E¹ (1) 11/28/2022 F12 E V Next PrtSc + 11 Insarrow_forwardUse the given data values (a sample of female arm circumferences in centimeters) to identify the corresponding z scores that are used for a normal quantile plot, then identify the coordinates of each point in the normal quantile plot. Construct the normal quantile plot, then determine whether the data appear to be from a population with a normal distribution. 44.2, 34.5, 38.2, 32.7, 40.9 Part A- List the z scores for the normal quantile plot. Part B- Identify the coordinates of each point in the normal quantile plot. Use ordered pairs for the form (x,y), where x is the sorted arm circumferences in ascending order, and y is the corresponding z score. Part C- Do the data come from a normally distributed population?arrow_forward
arrow_back_ios
arrow_forward_ios
Recommended textbooks for you
- MATLAB: An Introduction with ApplicationsStatisticsISBN:9781119256830Author:Amos GilatPublisher:John Wiley & Sons Inc
 Probability and Statistics for Engineering and th...StatisticsISBN:9781305251809Author:Jay L. DevorePublisher:Cengage Learning
 Statistics for The Behavioral Sciences (MindTap C...StatisticsISBN:9781305504912Author:Frederick J Gravetter, Larry B. WallnauPublisher:Cengage Learning
  Elementary Statistics: Picturing the World (7th E...StatisticsISBN:9780134683416Author:Ron Larson, Betsy FarberPublisher:PEARSON
 The Basic Practice of StatisticsStatisticsISBN:9781319042578Author:David S. Moore, William I. Notz, Michael A. FlignerPublisher:W. H. Freeman
 Introduction to the Practice of StatisticsStatisticsISBN:9781319013387Author:David S. Moore, George P. McCabe, Bruce A. CraigPublisher:W. H. Freeman
MATLAB: An Introduction with Applications
Statistics
ISBN:9781119256830
Author:Amos Gilat
Publisher:John Wiley & Sons Inc
Probability and Statistics for Engineering and th...
Statistics
ISBN:9781305251809
Author:Jay L. Devore
Publisher:Cengage Learning
Statistics for The Behavioral Sciences (MindTap C...
Statistics
ISBN:9781305504912
Author:Frederick J Gravetter, Larry B. Wallnau
Publisher:Cengage Learning
Elementary Statistics: Picturing the World (7th E...
Statistics
ISBN:9780134683416
Author:Ron Larson, Betsy Farber
Publisher:PEARSON
The Basic Practice of Statistics
Statistics
ISBN:9781319042578
Author:David S. Moore, William I. Notz, Michael A. Fligner
Publisher:W. H. Freeman
Introduction to the Practice of Statistics
Statistics
ISBN:9781319013387
Author:David S. Moore, George P. McCabe, Bruce A. Craig
Publisher:W. H. Freeman