MATLAB: An Introduction with Applications
6th Edition
ISBN: 9781119256830
Author: Amos Gilat
Publisher: John Wiley & Sons Inc
expand_more
expand_more
format_list_bulleted
Question

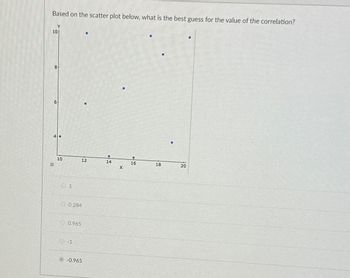
Transcribed Image Text:6
Based on the scatter plot below, what is the best guess for the value of the correlation?
Y
10
8
10
1
0.284
0.965
-1
-0.965
12 144
x
16
18
20
20
Expert Solution
This question has been solved!
Explore an expertly crafted, step-by-step solution for a thorough understanding of key concepts.
Step by stepSolved in 4 steps

Knowledge Booster
Similar questions
- sub-part 3. please help me with the rest. thanksarrow_forwardIdentify the type of correlation in the following scatter plot. e Skip step McCully, Aliyah 9. 24AMCCully21Carrow_forwarduse the sample data to construct a scatterplot. Use the first variable for the x-axis. Based on the scatterplot, what do you conclude about a linear correlation? FORECAST AND ACTUAL TEMPERATURES The table lists actual high temperatures and the high temperatures that were previously forecasted for these same days. The table includes data for ten different days near the author’s home. What does the result suggest about the accuracy of five-day predicted high temperatures?arrow_forward
- Construct a scatter plot for the given data. Determine whether there is a positive correlation, negative correlation, or no linear correlation. x-5-34 1 |-1-202 3-4 y11 6 |-6-13 4 1-4-58arrow_forwardPlease use the values from the given r values and assign the accurate value to the plots A,B,C, or D.arrow_forwardWeight (lbs.) 173 184 194 214 168 220 188 188 207 167 217 Systolic Blood Pressure 132 143 153 162 154 168 137 149 159 128 1 1. The sample correlation coefficient is _____________arrow_forward
- The table lists weights (pounds) and highway mileage amounts (mpg) for seven automobiles. Use the sample data to construct a scatterplot. Use the first variable for the x-axis. Based on the scatterplot, what do you conclude about a linear correlation? Weight (lb) Highway (mpg) Which scatterplot below shows the data? A. 40- 20- 2000 5000 2795 3225 3470 32 34 28 Weight (lb) B. 40- 20+ 2000 D 5000 Weight (lb) 4085 4155 2225 25 23 38 C. ● 20+ 2000 ● ● ● ● 5000 Weight (lb) Is there a linear relationship between weight and highway mileage? A. No, there appears to be no relationship. B. Yes, as the weight increases the highway mileage decreases. C. No, there appears to be a relationship, but it is not linear. D. Yes, as the weight increases the highway mileage increases. 40- 20- 2000 3440 29 5000 Weight (lb)arrow_forwardThe correlation between midterm and final grades for 300 students is 0.620. If 5 points are added to each midterm grade, the new r will be: a. 0.124 b. 0.57 c. 0.62 d. 0.744arrow_forwardWhich scatter plot shown has the strongest negative correlation?arrow_forward
- Use a graphing calculator to create a scatter plot and find the line of best fit and the correlation coefficient for the following data. Round to the nearest hundredth. X 2 4 6 8124 10 Part: 0/2 y 2 3 6 7 10 15 19arrow_forwardA food truck owner recorded the temperature at noon, in degrees Fahrenheit, and the number of bowls of soup sold during the lunch hour for a random sample of 5 days. The data are shown in the following table. Temperature (degrees Fahrenheit) 57 75 43 68 67 Number sold 17 12 20 8 13 The mean temperature of the sample is 62 degrees Fahrenheit, and the mean number sold is 14. What is the correlation between the temperature and the number sold? A -0.85 B -0.68 0.68 D 0.73 E 0.85arrow_forwardThe data below are the ages and annual pharmacy b ills (in dollars) of 9 randomly selected employees. Calculate the linear correlation coefficient.Age, x: 30, 33, 37, 40, 43, 45, 49, 53, 57Pharmacy bill ($), y: 119, 123, 126, 134, 145, 148, 151, 153, 155A. 0.890B. 0.908C. 0.998D. 0.960arrow_forward
arrow_back_ios
SEE MORE QUESTIONS
arrow_forward_ios
Recommended textbooks for you
 MATLAB: An Introduction with ApplicationsStatisticsISBN:9781119256830Author:Amos GilatPublisher:John Wiley & Sons Inc
 Probability and Statistics for Engineering and th...StatisticsISBN:9781305251809Author:Jay L. DevorePublisher:Cengage Learning
 Statistics for The Behavioral Sciences (MindTap C...StatisticsISBN:9781305504912Author:Frederick J Gravetter, Larry B. WallnauPublisher:Cengage Learning
 Elementary Statistics: Picturing the World (7th E...StatisticsISBN:9780134683416Author:Ron Larson, Betsy FarberPublisher:PEARSON
 The Basic Practice of StatisticsStatisticsISBN:9781319042578Author:David S. Moore, William I. Notz, Michael A. FlignerPublisher:W. H. Freeman
 Introduction to the Practice of StatisticsStatisticsISBN:9781319013387Author:David S. Moore, George P. McCabe, Bruce A. CraigPublisher:W. H. Freeman

MATLAB: An Introduction with Applications
Statistics
ISBN:9781119256830
Author:Amos Gilat
Publisher:John Wiley & Sons Inc

Probability and Statistics for Engineering and th...
Statistics
ISBN:9781305251809
Author:Jay L. Devore
Publisher:Cengage Learning

Statistics for The Behavioral Sciences (MindTap C...
Statistics
ISBN:9781305504912
Author:Frederick J Gravetter, Larry B. Wallnau
Publisher:Cengage Learning

Elementary Statistics: Picturing the World (7th E...
Statistics
ISBN:9780134683416
Author:Ron Larson, Betsy Farber
Publisher:PEARSON

The Basic Practice of Statistics
Statistics
ISBN:9781319042578
Author:David S. Moore, William I. Notz, Michael A. Fligner
Publisher:W. H. Freeman

Introduction to the Practice of Statistics
Statistics
ISBN:9781319013387
Author:David S. Moore, George P. McCabe, Bruce A. Craig
Publisher:W. H. Freeman