
MATLAB: An Introduction with Applications
6th Edition
ISBN: 9781119256830
Author: Amos Gilat
Publisher: John Wiley & Sons Inc
expand_more
expand_more
format_list_bulleted
Related questions
Question
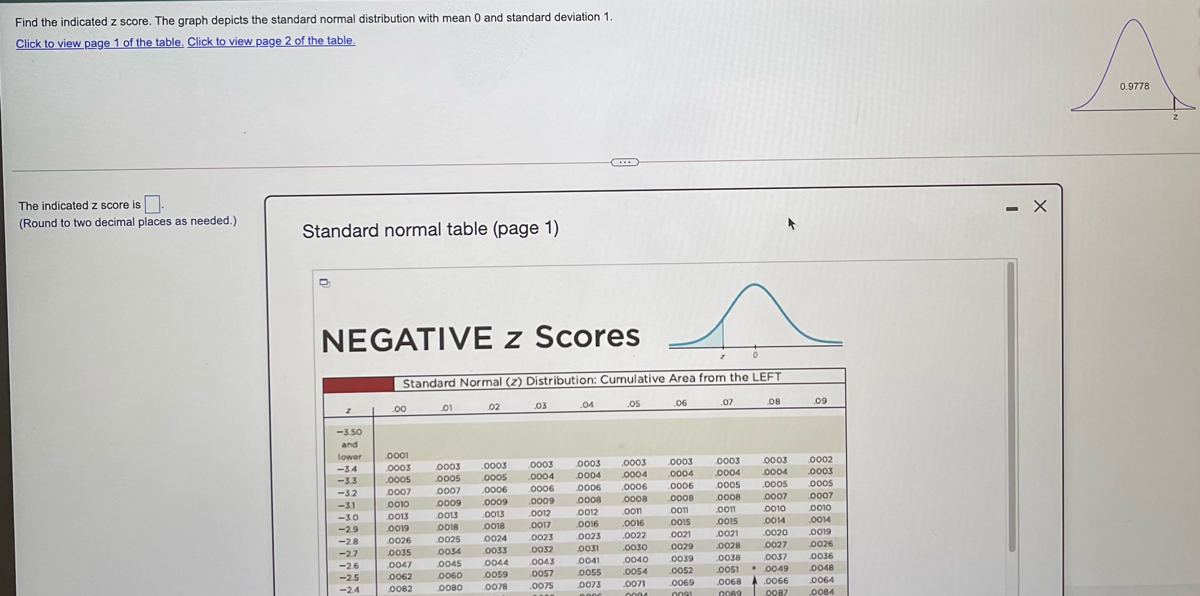

Transcribed Image Text:Find the indicated z score. The graph depicts the standard normal distribution with mean 0 and standard deviation 1.
Click to view page 1 of the table. Click to view page 2 of the table.
A.
0.9778
The indicated z score is.
(Round to two decimal places as needed.)
- X
Standard normal table (page 1)
NEGATIVE z Scores
Standard Normal (z) Distribution: Cumulative Area from the LEFT
00
01
02
03
04
os
.06
.07
08
.09
-3.50
and
lower
-34
-33
0001
0003
0003
0003
.000s
0007
0003
0003
0003
.0003
0003
0003
0002
0005
000s
.0004
0004
.0004
.0004
0004
0004
0003
.0005
0005
0007
o006
0006
0006
.0006
0008
-32
0007
0006
.000s
-31
o010
0009
0009
0009
0008
0008
0008
007
-3.0
0013
O013
.O013
o012
o012
oon
oon
oon
0010
o010
0019
O016
.O016
0022
.0030
-29
O018
0018
0017
O015
0015
0014
.O014
-2.8
0026
0025
0024
0023
0023
0021
0021
0020
o019
-2.7
O035
0034
0033
.0032
0031
0029
0028
0027
0026
0037
00s1. 0049
A 0066
OO89 0087
-26
0038
0036
0047
0062
0045
.0043
.0057
0041
0040
0039
.0052
0044
-25
0060
O059
0055
.0054
0048
-24
O082
O080
0078
0075
0073
.0071
.0069
0068
.0064
0004
0091
0084

Transcribed Image Text:Standard normal table (page 2)
POSITIVE z Scores
Standard Normal (z) Distribution: Cumulative Area from the LEFT
.00
01
02
.03
.04
.05
.06
.07
08
.09
0.0
5000
5040
5080
.5120
.5160
5199
.5239
5279
.5319
.5359
0.1
5398
5438
5478
5517
.5557
5596
„5636
.5675
.5714
5753
0.2
5793
5832
5871
5910
.5948
5987
.6026
.6064
.6103
.6141
0.3
.6179
6217
6255
6293
.6331
6368
.6406
.6443
6480
.6517
0.4
.6554
6591
6628
6664
.6700
6736
.6772
.6808
.6844
.6879
0.5
6915
6950
6985
7019
.7054
.7088
7123
7157
,기90
7224
0.6
.7257
.7291
7324
7357
7389
7422
7454
7486
7517
7549
0.7
7580
7ள
7642
.7673
.7704
.7734
.7764
7794
.7823
,7852
0.8
.7881
7910
.7939
7967
7995
.8023
.8051
8078
.8106
.8133
0.9
8159
8186
8212
8238
.8264
.8289
.8315
8340
.8365
.8389
1,0
8413
8438
8461
8485
8508
.8531
.8554
.8577
.8599
.8621
1.1
8643
8665
8686
8708
8729
.8749
8770
8790
.8810
.8830
1.2
8849
8869
8888
8907
.8925
8944
.8962
.8980
.8997
.9015
1,3
9032
9049
9066
.9082
.9099
.9115
.9131
.9147
.9162
.9177
1,4
9192
9207
9222
.9236
,9251
.9265
.9279
.9292
9306
,9319
1.5
.9332
9345
9357
9370
.9382
.9394
.9406
.9418
9429
.9441
1.6
.9452
9463
9474
9484
,9495 .
.9505
,9515
9525
,9535
.9545
1.7
.9554
9564
.9573
.9582
.9591
9599
.9608
9616
.9625
.9633
1,8
9641
9649
9656
.9664
.9671
.9678
,9686
9693
.9699
.9706
1.9
9713
9719
9726
9732
9738
9744
9750
9756
9761
.9767
2.0
9772
9778
9783
.9788
9793
.9798
.9803
,9808
.9812
.9817
21
9821
9826
9830
.9834
.9838
.9842
.9846
.9850
.9854
,9857
2.2
.9861
9864
9868
9871
.9875
.9878
.9881
.9884
.9887
.9890
9904
9906
Expert Solution
This question has been solved!
Explore an expertly crafted, step-by-step solution for a thorough understanding of key concepts.

This is a popular solution

Trending nowThis is a popular solution!

Step by stepSolved in 2 steps with 1 images

Knowledge Booster

Similar questions
- Find the indicated z score. The graph depicts the standard normal distribution with mean 0 and standard deviation 1 . Shaded area is 0.8737 .arrow_forwardFind the indicated z score. The graph depicts the standard normal distribution with mean 0 and standard deviation 1. The indicated z score is (Round to two decimal places as needed.)arrow_forwardFor a standard normal distribution, find the probability that a value is greater than 0.26 standard deviations below the mean and less than 0.21 standard deviation above the mean.arrow_forward
- Find the indicated z score. The graph depicts the standard normal distribution with mean 0 and standard deviation 1. The indicated z score is (Round to two decimal places as needed.)arrow_forwardFind the indicated z score. The graph depicts the standard normal distribution with mean 0 and standard deviation 1. Click to view page 1 of the table. LOADING... Click to view page 2 of the table. LOADING... z 0.9535 A graph with a bell-shaped curve, divided into 2 regions by a line from top to bottom on the right side. The region left of the line is shaded and is labeled 0.9535. Question content area bottom Part 1 The indicated z score is enter your response here. (Round to two decimal places as needed.)arrow_forwardFind the indicated Z score. The graph depicts the standard normal distribution with mean 0 and standard deviation 1.arrow_forward
- Find the indicated z score. The graph depicts the standard normal distribution with mean 0 and standard deviation 1. The indicated z score is (Round to two decimal places as needed.) A 20 0.7486 Carrow_forwardFind the indicated z score. The graph depicts the standard normal distribution with mean 0 and standard deviation 1. The indicated z score is (Round to two decimal places as needed.) 0 Z 0.1469arrow_forward
arrow_back_ios
arrow_forward_ios
Recommended textbooks for you
- MATLAB: An Introduction with ApplicationsStatisticsISBN:9781119256830Author:Amos GilatPublisher:John Wiley & Sons Inc
 Probability and Statistics for Engineering and th...StatisticsISBN:9781305251809Author:Jay L. DevorePublisher:Cengage Learning
 Statistics for The Behavioral Sciences (MindTap C...StatisticsISBN:9781305504912Author:Frederick J Gravetter, Larry B. WallnauPublisher:Cengage Learning
  Elementary Statistics: Picturing the World (7th E...StatisticsISBN:9780134683416Author:Ron Larson, Betsy FarberPublisher:PEARSON
 The Basic Practice of StatisticsStatisticsISBN:9781319042578Author:David S. Moore, William I. Notz, Michael A. FlignerPublisher:W. H. Freeman
 Introduction to the Practice of StatisticsStatisticsISBN:9781319013387Author:David S. Moore, George P. McCabe, Bruce A. CraigPublisher:W. H. Freeman
MATLAB: An Introduction with Applications
Statistics
ISBN:9781119256830
Author:Amos Gilat
Publisher:John Wiley & Sons Inc
Probability and Statistics for Engineering and th...
Statistics
ISBN:9781305251809
Author:Jay L. Devore
Publisher:Cengage Learning
Statistics for The Behavioral Sciences (MindTap C...
Statistics
ISBN:9781305504912
Author:Frederick J Gravetter, Larry B. Wallnau
Publisher:Cengage Learning
Elementary Statistics: Picturing the World (7th E...
Statistics
ISBN:9780134683416
Author:Ron Larson, Betsy Farber
Publisher:PEARSON
The Basic Practice of Statistics
Statistics
ISBN:9781319042578
Author:David S. Moore, William I. Notz, Michael A. Fligner
Publisher:W. H. Freeman
Introduction to the Practice of Statistics
Statistics
ISBN:9781319013387
Author:David S. Moore, George P. McCabe, Bruce A. Craig
Publisher:W. H. Freeman