
MATLAB: An Introduction with Applications
6th Edition
ISBN: 9781119256830
Author: Amos Gilat
Publisher: John Wiley & Sons Inc
expand_more
expand_more
format_list_bulleted
Related questions
Question
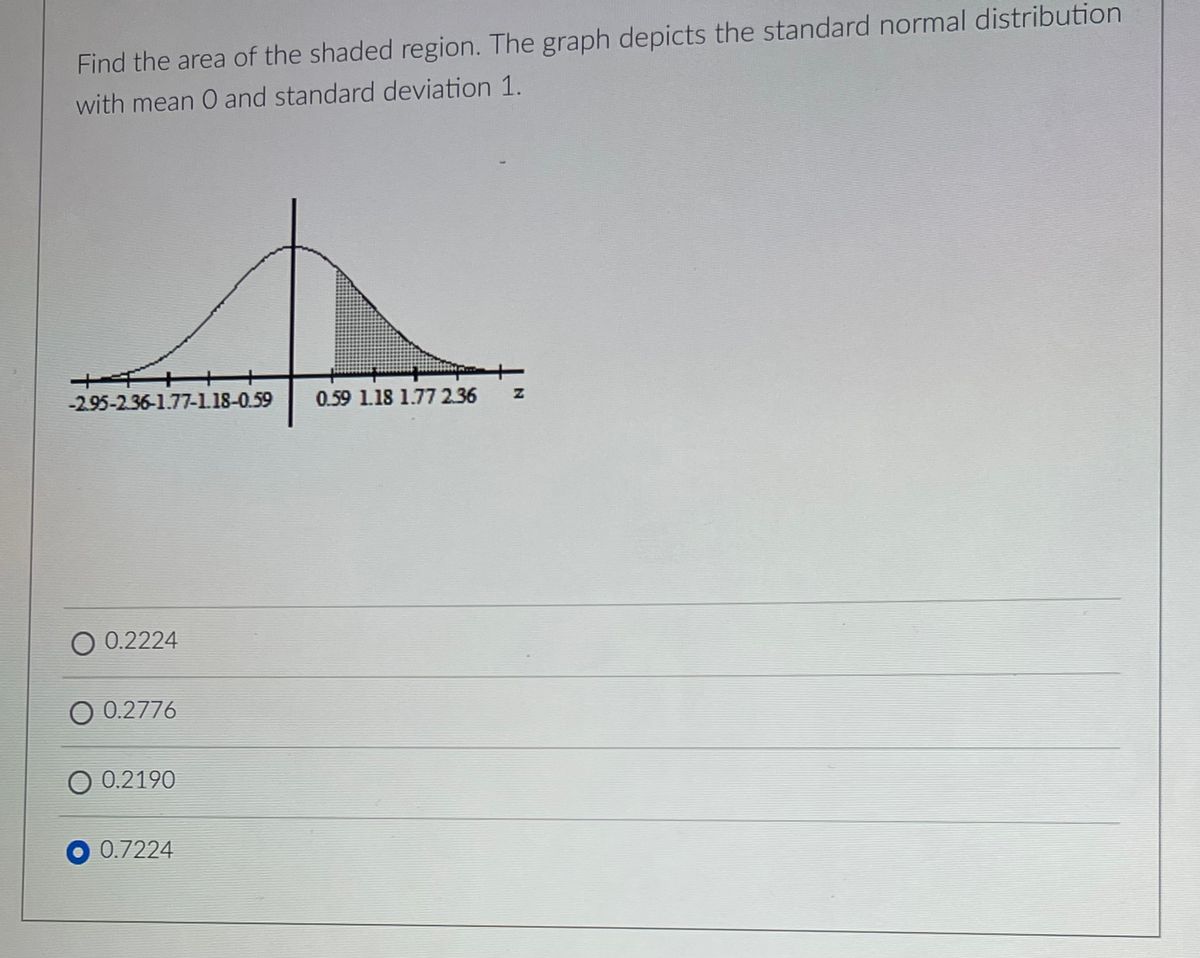

Transcribed Image Text:Find the area of the shaded region. The graph depicts the standard normal distribution
with mean O and standard deviation 1.
-2.95-2.36-1.77-1.18-0.59
O 0.2224
O 0.2776
O 0.2190
0.7224
0.59 1.18 1.77 2.36
Expert Solution
This question has been solved!
Explore an expertly crafted, step-by-step solution for a thorough understanding of key concepts.

This is a popular solution

Trending nowThis is a popular solution!

Step by stepSolved in 3 steps with 3 images

Knowledge Booster

Similar questions
- Find the area of the shaded region. The graph depicts the standard normal distribution with mean 0 and standard deviation 1. Click to view page 1 of the table. LOADING... Click to view page 2 of the table. LOADING... z=0.64 A graph with a bell-shaped curve, divided into 2 regions by a line from top to bottom on the right side. The region left of the line is shaded. The z-axis below the line is labeled "z=0.64". Question content area bottom Part 1 The area of the shaded region is? enter your response here.arrow_forwardFind the approximate area of the shaded region . The graph depicts the standard normal deviation Z~N(0,1)arrow_forwardFind the area of the shaded region. The graph depicts the standard normal distribution with mean 0 and standard deviation 1. Round to four decimal places. + -1.82 1.82 ..... O A. 0.4656 O B. -0.0344 O C. 0.9656 O D. 0.0344 O Time MacBook . .... .. .... .. DII DD 80 000 000 F8 F7 esc F4 F5 F6 F3arrow_forward
- Find the area of the shaded region. The graph to the right depicts IQ scores of adults, and those scores are normally distributed with a mean of 100 and a standard deviation of 15.arrow_forwardFind the area of the shaded region. The graph depicts the standard normal distribution of bone density scores with mean 0 and standard deviation 1. 2= -0.81 z=1.21 The area of the shaded region is (Round to four decimal places as needed.)arrow_forwardFind the area of the shaded region. The graph depicts the standard normal distribution with mean 0 and standard deviation 1. Click to view page 1 of the table. Click to view page 2 of the table. Standard normal distribution table (page 1) 7=065 .09 .08 .07 .06 .05 .04 .03 .02 .01 .00 The area of the shaded region is. Standard normal distribution table (page 2) -3.4 .0002 .0003 .0003 .0003 .0003 .0003 .0003 .0003 0003 .0003 3.4 - 3.3 - 3.2 - 3.1 - 3.0 - 2.9 .0003 .0004 .0004 .0004 .0004 .0004 .0004 .0005 .0005 .0005 -3.3 (Round to four decimal places as needed.) .0007 .0010 - 3.2 - 3.1 .0005 .0005 .0005 .0006 .0006 .0006 .0006 .0006 .0007 .0007 .0007 .0008 .0008 .0008 .0008 .0009 .0009 .0009 .0010 .0010 .0011 .0011 .0011 .0012 .0012 .0013 .0013 .0013 -3.0 .00 .01 .02 .03 .04 .05 .06 .07 .08 .09 - 2.9 - 2.8 - 2.7 .0014 .0014 .0015 .0015 .0016 .0016 .0017 .0018 .0018 .0019 0.0 5000 .5040 .5080 .5120 .5160 .5199 .5239 .5279 5319 5359 0.0 .0026 .0035 -2.8 .0019 .0020 .0021 .0021 .0022 .0023…arrow_forward
- Find the area of the shaded region. The graph below depicts the standard normal distribution with a mean of 0 and a standard deviation of 1. (Round to 4 decimal places)arrow_forwardFind the area of the shaded region. The graph depicts the standard normal distribution with mean 0 and standard deviation 1. Click to view page 1 of the table. Click to view page 2 of the table. The area of the shaded region is. (Round to four decimal places as needed.) Standard Normal Distribution Table (Page 2) z 0.0 0.1 0.2 0.3 0.4 0.5 0.6 0.7 0.8 0.9 1.0 1.1 1.2 1.3 1.4 1.5 1.6 1.7 1.8 1.9 2.0 2.1 2.2 2.3 2.4 2.5 2.6 2.7 2.8 2.9 3.0 3.1 3.2 3.3 3.4 Z Standard Normal Distribution Area 0.0 0.1 0.2 7881 7910 8159 8186 8413 8438 8643 .8665 8849 .8869 .9032 .9049 9147 9162 9177 .9292 9306 9319 .00 .01 .02 .03 .04 .05 .06 .07 .08 .09 5000 5040 5080 5120 5160 5199 5239 5279 5319 5359 5398 5438 5478 5517 5557 5596 5636 5675 5714 5753 5793 5832 5871 5910 5948 5987 6026 6064 6103 6141 6179 6217 6255 .6293 6331 .6368 6406 6443 6480 6517 0.3 6554 .6591 .6628 .6664 6700 6736 6772 6808 6844 6879 0.4 6915 6950 .6985 .7019 .7054 .7088 .7123 .7157 7190 7224 0.5 7257 .7291 .7324 .7357 .7389 7422…arrow_forwardFind the z-score for the given shaded region under the standard normal distribution. Round your answer to two decimal places. Shaded Area = 0.34 %3D + + -4 -3 -2 -1 1 3 4 2.arrow_forward
- Find the area of the shaded region. The graph depicts the standard normal distribution with mean O and standard deviation 1. Click to view page 1 of the table. Click to view page 2 of the table. The area of the shaded region is (Round to four decimal places as needed.) z = 0.83arrow_forwardFind the area of the shaded region. The graph depicts the standard normal distribution with mean 0 and standard deviation 1. Click to view page 1 of the table Click to view page 2 of the table z-0.47 The area of the shaded region is (Round to four decimal places as needed.)arrow_forwardFind the area of the shaded region. The graph depicts the standard normal distribution with mean 0 and standard deviation 1. the area of the shaded region is ?arrow_forward
arrow_back_ios
arrow_forward_ios
Recommended textbooks for you
- MATLAB: An Introduction with ApplicationsStatisticsISBN:9781119256830Author:Amos GilatPublisher:John Wiley & Sons Inc
 Probability and Statistics for Engineering and th...StatisticsISBN:9781305251809Author:Jay L. DevorePublisher:Cengage Learning
 Statistics for The Behavioral Sciences (MindTap C...StatisticsISBN:9781305504912Author:Frederick J Gravetter, Larry B. WallnauPublisher:Cengage Learning
  Elementary Statistics: Picturing the World (7th E...StatisticsISBN:9780134683416Author:Ron Larson, Betsy FarberPublisher:PEARSON
 The Basic Practice of StatisticsStatisticsISBN:9781319042578Author:David S. Moore, William I. Notz, Michael A. FlignerPublisher:W. H. Freeman
 Introduction to the Practice of StatisticsStatisticsISBN:9781319013387Author:David S. Moore, George P. McCabe, Bruce A. CraigPublisher:W. H. Freeman
MATLAB: An Introduction with Applications
Statistics
ISBN:9781119256830
Author:Amos Gilat
Publisher:John Wiley & Sons Inc
Probability and Statistics for Engineering and th...
Statistics
ISBN:9781305251809
Author:Jay L. Devore
Publisher:Cengage Learning
Statistics for The Behavioral Sciences (MindTap C...
Statistics
ISBN:9781305504912
Author:Frederick J Gravetter, Larry B. Wallnau
Publisher:Cengage Learning
Elementary Statistics: Picturing the World (7th E...
Statistics
ISBN:9780134683416
Author:Ron Larson, Betsy Farber
Publisher:PEARSON
The Basic Practice of Statistics
Statistics
ISBN:9781319042578
Author:David S. Moore, William I. Notz, Michael A. Fligner
Publisher:W. H. Freeman
Introduction to the Practice of Statistics
Statistics
ISBN:9781319013387
Author:David S. Moore, George P. McCabe, Bruce A. Craig
Publisher:W. H. Freeman