
MATLAB: An Introduction with Applications
6th Edition
ISBN: 9781119256830
Author: Amos Gilat
Publisher: John Wiley & Sons Inc
expand_more
expand_more
format_list_bulleted
Related questions
Concept explainers
Topic Video
Question
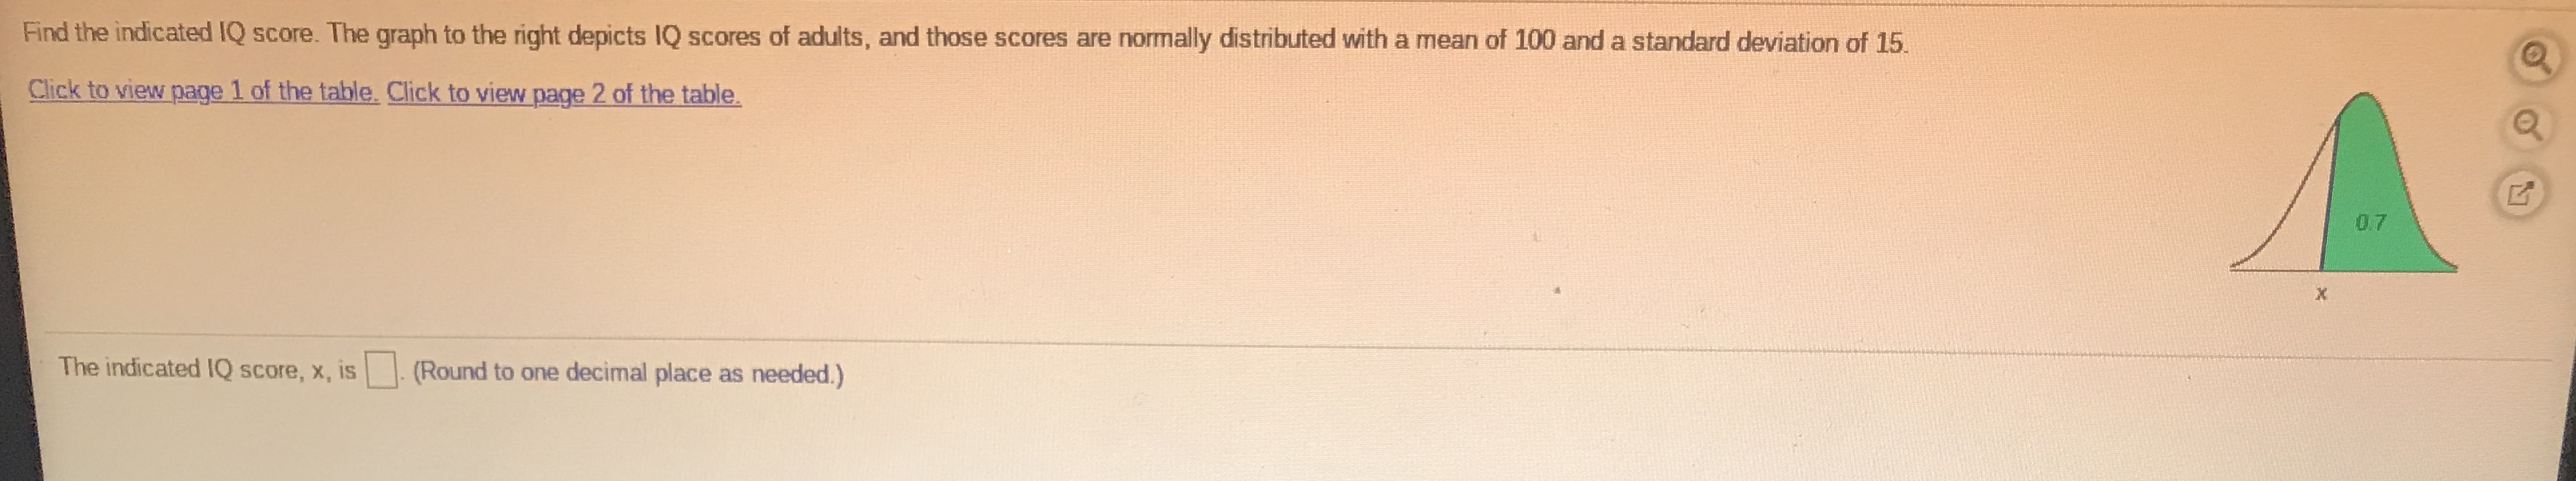

Transcribed Image Text:Find the indicated IQ score. The graph to the right depicts IQ scores of adults, and those scores are normally distributed with a mean of 100 and a standard deviation of 15.
Click to view page 1 of the table. Click to view page 2 of the table.
The indicated IQ score, x, is
(Round to one decimal place as needed.)
Expert Solution
This question has been solved!
Explore an expertly crafted, step-by-step solution for a thorough understanding of key concepts.

This is a popular solution

Trending nowThis is a popular solution!

Step by stepSolved in 2 steps with 1 images

Knowledge Booster


Learn more about
Need a deep-dive on the concept behind this application? Look no further. Learn more about this topic, statistics and related others by exploring similar questions and additional content below.Similar questions
- Complete the table for doing a norm scores plot that would be used in determining if the data are from a normal population. You do not need to do the plot. X Norm Score 122 141 163 178 209 223 240arrow_forward166arrow_forwardUse the dotplot to find the mean, median, and IQR. Round to 1 decimal place, if needed. Caution: This could be a different data set than the one in the previous question. 74 76 78 80 82 84 86 Heights of Basketball Players mean median IQR (in inches) (in inches) (in inches)arrow_forward
- someone please answer these questionsarrow_forwardRefer to the data set of body temperatures in degrees Fahrenheit given in the accompanying table and use software or a calculator to find the mean and median. Do the results support or contradict the common belief that the mean body temperature is 98.6°F? A. The mean of the data set is °F. (Round to two decimal places as needed.) B. The median of the data set is °F. (Type an integer or a decimal. Do not round.)arrow_forwardHelp with #14 pleasearrow_forward
- We have provided simple data sets for you to practice the basics of finding measures of variation. For each data set, determine the a. range. b. sample standard deviation. 4, 2, 0, 2, 2arrow_forwardPlease answer a and barrow_forwardRun the descriptive statistics for hrs/week of exercise. Include the mean, median, quartiles, min, max, standard deviation and IQR. First do this for hrs/week of exercise overall. Copy and paste the values below. Then redo this splitting up the data by sex. Copy and paste that below too. What similarities and/or differences do you see? Age Gender Height Arm Length Number Siblings Birth Order Handedness Number Classes Number Credits Hrs. Exercise Athlete at Broome Hrs. TV Award Pulse Number Piercings Facebook Friends Followers on Instagram Tattoo Division Local section 18 f 63 27.5 2 3 r 4 14 1.5 n 3 NP 74 2 82 72 n HS y 4 19 m 74 31.5 4 5 r 4 11 5 n 1.5 O 0 600 700 n STEM y 4 17 f 66 29.2 2 2 l 6 15 5 y 21 NP 64 2 1801 1370 n HS y 4 18 f 66 30 5 5 r 4 12 30 n 15 NP 91 1…arrow_forward
- Find the area of the shaded region. The graph to the right depicts IQ scores of adults, and those scores are normally distributed with a mean of 100 and a standard deviation of 15. Click to view page 1 of the table. Click to view page 2 of the table. The area of the shaded region is (Round to four decimal places as needed.) 85 95 120 ☑arrow_forwardThe amount of caffeine in a sample of five-ounce servings of brewed coffee is shown in the histogram. Make a frequency distribution for the data. Then use the table to estimate the sample mean and the sample standard deviation of the data set. Click the icon to view the histogram. Complete the table. Round values to the nearest tenth as needed. Graph/chart f Midpoint x xf 70.5 Ay 30- 92.5 26 25- 114.5 136.5 20- 158.5 15- 12 Ef = Exf = 10- Find the mean of the data set. 5- X = (Round to the nearest tenth as needed.) 48.5 70.5 92.5 114.5 136.5 158.5 Complete the table. Round values to the nearest tenth as needed. Midpoint x (x-x)? (x-x)?f X-X 70.5 Print Done 92.5 114.5 136.5 158.5 (x-x)?r= ] ofarrow_forwardFind the indicated IQ score. The graph to the right depicts IQ scores of adults, and those scores are normally distributed with a mean of 100 and a standard deviation of 15. Click to view page 1 of the table. Click to view page 2 of the table. 0.6 X (Round to one decimal place as needed.) The indicated IQ score, x, IS onter ucces ia Lib Optio Enter your answer in the answer box and then click Check Answer. Final Check Tools Clear All All parts showing TIVGILY Ucy E SSTOITS COnTtact s ZUT Ptarson uutatioT ITC ATTTETS Eservet. TCITTIS V DSe Copyrigiit ions 6:33 PM 11/29/2019 а OEt Type here to searcharrow_forward
arrow_back_ios
SEE MORE QUESTIONS
arrow_forward_ios
Recommended textbooks for you
- MATLAB: An Introduction with ApplicationsStatisticsISBN:9781119256830Author:Amos GilatPublisher:John Wiley & Sons Inc
 Probability and Statistics for Engineering and th...StatisticsISBN:9781305251809Author:Jay L. DevorePublisher:Cengage Learning
 Statistics for The Behavioral Sciences (MindTap C...StatisticsISBN:9781305504912Author:Frederick J Gravetter, Larry B. WallnauPublisher:Cengage Learning
  Elementary Statistics: Picturing the World (7th E...StatisticsISBN:9780134683416Author:Ron Larson, Betsy FarberPublisher:PEARSON
 The Basic Practice of StatisticsStatisticsISBN:9781319042578Author:David S. Moore, William I. Notz, Michael A. FlignerPublisher:W. H. Freeman
 Introduction to the Practice of StatisticsStatisticsISBN:9781319013387Author:David S. Moore, George P. McCabe, Bruce A. CraigPublisher:W. H. Freeman
MATLAB: An Introduction with Applications
Statistics
ISBN:9781119256830
Author:Amos Gilat
Publisher:John Wiley & Sons Inc
Probability and Statistics for Engineering and th...
Statistics
ISBN:9781305251809
Author:Jay L. Devore
Publisher:Cengage Learning
Statistics for The Behavioral Sciences (MindTap C...
Statistics
ISBN:9781305504912
Author:Frederick J Gravetter, Larry B. Wallnau
Publisher:Cengage Learning
Elementary Statistics: Picturing the World (7th E...
Statistics
ISBN:9780134683416
Author:Ron Larson, Betsy Farber
Publisher:PEARSON
The Basic Practice of Statistics
Statistics
ISBN:9781319042578
Author:David S. Moore, William I. Notz, Michael A. Fligner
Publisher:W. H. Freeman
Introduction to the Practice of Statistics
Statistics
ISBN:9781319013387
Author:David S. Moore, George P. McCabe, Bruce A. Craig
Publisher:W. H. Freeman