MATLAB: An Introduction with Applications
6th Edition
ISBN: 9781119256830
Author: Amos Gilat
Publisher: John Wiley & Sons Inc
expand_more
expand_more
format_list_bulleted
Question
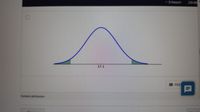
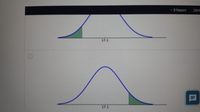
Find the graph that matches the following hypothesis test.
H0:p=17.1, Ha:p<17.1

Transcribed Image Text:-3 hours
29/40
17.1
BFEE
Content attribution

Transcribed Image Text:-3 hours
29/4
17.1
17.1
Expert Solution
This question has been solved!
Explore an expertly crafted, step-by-step solution for a thorough understanding of key concepts.
This is a popular solution
Trending nowThis is a popular solution!
Step by stepSolved in 2 steps with 1 images

Knowledge Booster
Learn more about
Need a deep-dive on the concept behind this application? Look no further. Learn more about this topic, statistics and related others by exploring similar questions and additional content below.Similar questions
- A student organization surveyed both current students and recent graduates to obtain information on the quality of teaching at a particular university. An analysis of the responses provided the following teaching-ability rankings. Professor O Ho: Ps+0 H₂: Ps=0 O Ho: Ps ≤0 Ha: P >0 1 Ho: Ps > 0 H₂: Ps=0 2 Ho: Ps= 0 Ha: Ps * 0 3 4 5 6 7 9 10 Current Students 4 6 8 3 1 2 5 10 7 9 Recent Graduates 6 8 5 1 2 3 7 Do the rankings given by the current students agree with the rankings given by the recent graduates? Compute the rank correlation between current students and recent graduates. (Round your answer to three decimal places.) 9 Use α = 0.10 and test for a significant rank correlation. State the null and alternative hypotheses. O Ho: P₂ ZO Ha: Ps <0 10 4 Find the value of the test statistic. (Round your answer to two decimal places.) Find the p-value. (Round your answer to four decimal places.) p-value= What is your conclusion? O Reject Ho. There is not sufficient evidence to conclude…arrow_forwardAfter visiting the Titanic, Captain Brain and Mr. Pinky are taking the Alvin submarine back to the surface of the water. They start 1900 meters below the surface of the water, and ascend at 62 meters per hour.Note: under the water is a negative number.Write an equation to model this situation (use mm for meters and hh for hours)arrow_forward11. Add 6 to each number in the dataset. Then, the 15th percentile is:a. 1b. 6c. 8d. 7Use the following information to answer questions 12-14: Suppose the probability that an adult gets thenews from Facebook is 0.60. A random sample of 14 adults were surveyed to determine X, the numberof adults who get their news from Facebook.12. Which of the following statements is false?a. The set of possible x-values is {1, 2, 3, . . ., 14}b. X ~ B (14, 0.60)c. P(X=5) = 0.0408d. µ = 8.413. Find the probability that at least 6 adults get their news from Facebook.a. 0.8499b. 6/14c. 0.6429d. 0.941714. X is of data of type:a. categorical nominalb. categorical ordinalc. numerical continuousd. numerical discrete15. Suppose that the ages of Brunswick CC students are normally distributed. A random sample of 6Brunswick CC students reported the ages of 20, 35, 18, 45, 27, and 20 years old. Find the errorbound that corresponds to the 90% confidence interval for the true population mean age ofBrunswick CC…arrow_forward
- Use SPSS for this Application Exercise: A health psychologist want to investigate whether there is a relationship between sex and food preference. The psychologist gave participants a questionnaire that asked which food the participants would choose to eat given the choice. What can be concluded with an a of 0.05? Food Sex spaghetti carrots donuts female 20 16 21 male 25 18 i. What is the appropriate test statistic? --Select- Compute the statistic selected in a): ii Obtain/compute the appropriate values to make a decision about Ho- p-value = Decision: -Select-- i Compute the corresponding effect size(s) and indicate magnitude(s). If not appropriate, input and/or select "na" below. Effect Size = ]: Magnitude: -Select-- iv I Make an interpretation based on the results. O There is a significant negative relationship between sex and food preference. O There is a significant food preference difference between sex. O Food preference and sex are independent.arrow_forwardThe results: A. Are, or B. Are not significantly: A. High, or B. Low so there: A. is, or B. is notarrow_forward1arrow_forward
- Is there an association between daily screen time and exercise habits in high school students? Mia selects a random sample of 123 high school students and categorizes them into 1 of 3 categories of screen time and whether they exercise. She would like to determine if there is convincing evidence of an association. Let = 0.05. What are the hypotheses for this test? H0: There is an association between daily screen time and exercise habits in high school students.Ha: There is no association between daily screen time and exercise habits in high school students.H0: There is no association between daily screen time and exercise habits in high school students.Ha: There is an association between daily screen time and exercise habits in high school students.H0: There is no difference in the distribution of daily screen time and exercise habits in high school students.Ha: There is a difference in the distribution of daily screen time and exercise habits in high school students.H0: There is a…arrow_forwardIn a survey, 32% of the respondents stated that they talk to their pets on the telephone. A veterinarian believed this result to be too high, so she randomly selected 230 pet owners and discovered that 66 of them spoke to their pet on the telephone. Does the veterinarian have a right to be skeptical? Use the α=0.1 level of significance. Find test statistic and p valuearrow_forwardPlease help with this statistics problem. A traffic light at a certain intersection is green 45% of the time, yellow 10% of the time, and red 45% of the time. A car approaches this intersection once each day. Let X represent the number of days that pass up to and including the first time the car encounters a red light. Assume that each day represents an independent trial. A.) Find P(X=3). B.) Find P(X<=3) C.) Find ux. D.) Find 02/x.arrow_forward
- A researcher believe that increasing attention given to children will improve academic performance. He invites parents to volunteer during school to help the children with their activities. At the end of the school year he compares the academic performance of these children with the mean and standard deviation of historical rate on academic achievement. Which statistic test is appropriate for this study and why? (By using the decision tree). A. Z test B. Single sample t test C. Two independent samples t test D. Two related samples t test E. One way between subjects ANOVA F. Correlationarrow_forwardThe time needed to find a parking space is normally distributed with a mean of 20 minutes and a standard deviation of 5.18 minutes. 90% of the time, it takes less than how many minutes to find a parking space?arrow_forwardK A study was conducted to determine the proportion of people who dream in black and white instead of color. Among 298 people over the age of 55, 69 dream in black and white, and among 310 people under the age of 25, 15 dream in black and white. Use a 0.01 significance level to test the claim that the proportion of people over 55 who dream in black and white is greater than the proportion for those under 25. Complete parts (a) through (c) below. this 2 W S x H nd a. Test the claim using a hypothesis test. Consider the first sample to be the sample of people over the age of 55 and the second sample to be the sample of people under the age of 25. What are the null and alternative hypotheses for the hypothesis test? OA. Ho: P₁2P2 H₁: P₁ P2 OD. Ho: P1 P2 H₁: P₁ = P2 Identify the test statistic. Z= View an example (Round to two decimal places as needed.) 35 E D с Get more help. NOV 20 R F V ▲ % S T G B stv OB. Ho: P1 SP2 H₁: P₁ P2 OE. Ho: P1 P2 H₁: P₁ P2 MacBook Air Y H SA JA N www J # 00 8…arrow_forward
arrow_back_ios
arrow_forward_ios
Recommended textbooks for you
 MATLAB: An Introduction with ApplicationsStatisticsISBN:9781119256830Author:Amos GilatPublisher:John Wiley & Sons Inc
 Probability and Statistics for Engineering and th...StatisticsISBN:9781305251809Author:Jay L. DevorePublisher:Cengage Learning
 Statistics for The Behavioral Sciences (MindTap C...StatisticsISBN:9781305504912Author:Frederick J Gravetter, Larry B. WallnauPublisher:Cengage Learning
 Elementary Statistics: Picturing the World (7th E...StatisticsISBN:9780134683416Author:Ron Larson, Betsy FarberPublisher:PEARSON
 The Basic Practice of StatisticsStatisticsISBN:9781319042578Author:David S. Moore, William I. Notz, Michael A. FlignerPublisher:W. H. Freeman
 Introduction to the Practice of StatisticsStatisticsISBN:9781319013387Author:David S. Moore, George P. McCabe, Bruce A. CraigPublisher:W. H. Freeman

MATLAB: An Introduction with Applications
Statistics
ISBN:9781119256830
Author:Amos Gilat
Publisher:John Wiley & Sons Inc

Probability and Statistics for Engineering and th...
Statistics
ISBN:9781305251809
Author:Jay L. Devore
Publisher:Cengage Learning

Statistics for The Behavioral Sciences (MindTap C...
Statistics
ISBN:9781305504912
Author:Frederick J Gravetter, Larry B. Wallnau
Publisher:Cengage Learning

Elementary Statistics: Picturing the World (7th E...
Statistics
ISBN:9780134683416
Author:Ron Larson, Betsy Farber
Publisher:PEARSON

The Basic Practice of Statistics
Statistics
ISBN:9781319042578
Author:David S. Moore, William I. Notz, Michael A. Fligner
Publisher:W. H. Freeman

Introduction to the Practice of Statistics
Statistics
ISBN:9781319013387
Author:David S. Moore, George P. McCabe, Bruce A. Craig
Publisher:W. H. Freeman