MATLAB: An Introduction with Applications
6th Edition
ISBN: 9781119256830
Author: Amos Gilat
Publisher: John Wiley & Sons Inc
expand_more
expand_more
format_list_bulleted
Question
thumb_up100%
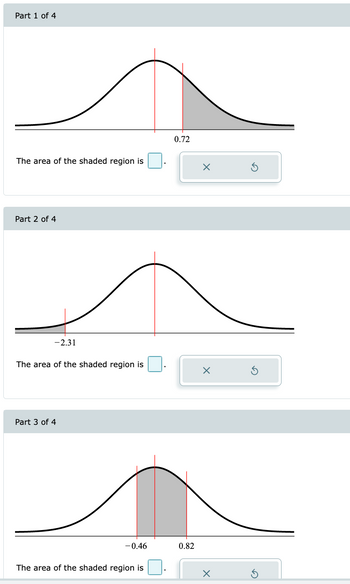
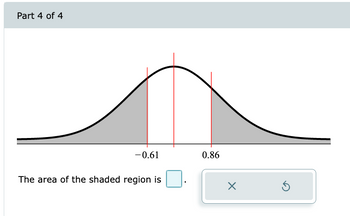
Find each of the shaded areas under the standard normal curve using a TI-84 calculator. Round the answers to four decimal places.

Transcribed Image Text:Part 1 of 4
The area of the shaded region is
Part 2 of 4
-2.31
The area of the shaded region is
Part 3 of 4
-0.46
The area of the shaded region is
0.72
0.82
X
X
X

Transcribed Image Text:Part 4 of 4
-0.61
The area of the shaded region is
0.86
X
Ś
Expert Solution
This question has been solved!
Explore an expertly crafted, step-by-step solution for a thorough understanding of key concepts.
This is a popular solution
Trending nowThis is a popular solution!
Step by stepSolved in 2 steps

Knowledge Booster
Similar questions
- To compute a student's Grade Point Average (GPA) for a term, the student's grades for each course are weighted by the number of credits for the course. Suppose a student had these grades: 4.0 in a 5 credit Math course 2.5 in a 3 credit Music course 2.7 in a 5 credit Chemistry course 3.3 in a 6 credit Journalism course What is the student's GPA for that term? Round to two decimal places Student's GPA =arrow_forwardFind the t values for each of the following cases. b. Lower tail area of .05 with 50 degrees of freedomarrow_forward21 d-farrow_forward
- In each part, find the area under the standard normal curve that lies between the specified z-score, sketch a standard normal curve, and shade the area of interest. b. -2 and 2 c. - 3 and 3 a. - 1 and 1 a. Find the area under the standard normal curve that lies between - 1 and 1, sketch a standard normal curve, and shade the area of interest. The area under the standard normal curve that lies between - 1 and 1 is (Type an integer or decimal rounded to four decimal places as needed.)arrow_forwardOL th.. Frequency 8 9 0 T 10 20 30 40 LEAD 50 60 70 80 Data were collected on the lead levels of children of battery factory workers. The data are displayed in the histogram above. Choose the correct answer. The maximum lead level is less than 60 The median lead level (the level that exactly half the children exceed) is less than 30 There are 33 children in the data set. None of the other answers is truearrow_forwardQuestion 12 A variable is normally distributed with mean 22 and standard deviation 7. Use your graphing calculator to find each of the following areas. Write your answers in decimal form. Round to the nearest thousandth as needed. a) Find the area to the left of 22. b) Find the area to the left of 20. c) Find the area to the right of 21. d) Find the area to the right of 23. e) Find the area between 20 and 29. Question Help: D Post to forum Calculator Submit Questionarrow_forward
- Q.8arrow_forwardFind two z values, one positive and one negative, that are equidistant from the mean so that the areas in the two tails total 6%. Use a TI-83 Plus/TI- 84 Plus calculator and round the answer to four decimal places, separated by a comma if needed. X ** $ oloarrow_forwardBig babies: The National Health Statistics Reports described a study in which a sample of 354 one-year-old baby boys were weighed. Their mean weight was 25.8 pounds with standard deviation 5.3 pounds. A pediatrician claims that the mean weight of one-year-old boys is greater than 25 pounds. Do the data provide convincing evidence that the pediatrician's claim is true? Use the a=0.05 level of significance and the P-value method with the TI-84 Plus calculator. Part 1 of 5arrow_forward
arrow_back_ios
arrow_forward_ios
Recommended textbooks for you
 MATLAB: An Introduction with ApplicationsStatisticsISBN:9781119256830Author:Amos GilatPublisher:John Wiley & Sons Inc
 Probability and Statistics for Engineering and th...StatisticsISBN:9781305251809Author:Jay L. DevorePublisher:Cengage Learning
 Statistics for The Behavioral Sciences (MindTap C...StatisticsISBN:9781305504912Author:Frederick J Gravetter, Larry B. WallnauPublisher:Cengage Learning
 Elementary Statistics: Picturing the World (7th E...StatisticsISBN:9780134683416Author:Ron Larson, Betsy FarberPublisher:PEARSON
 The Basic Practice of StatisticsStatisticsISBN:9781319042578Author:David S. Moore, William I. Notz, Michael A. FlignerPublisher:W. H. Freeman
 Introduction to the Practice of StatisticsStatisticsISBN:9781319013387Author:David S. Moore, George P. McCabe, Bruce A. CraigPublisher:W. H. Freeman

MATLAB: An Introduction with Applications
Statistics
ISBN:9781119256830
Author:Amos Gilat
Publisher:John Wiley & Sons Inc

Probability and Statistics for Engineering and th...
Statistics
ISBN:9781305251809
Author:Jay L. Devore
Publisher:Cengage Learning

Statistics for The Behavioral Sciences (MindTap C...
Statistics
ISBN:9781305504912
Author:Frederick J Gravetter, Larry B. Wallnau
Publisher:Cengage Learning

Elementary Statistics: Picturing the World (7th E...
Statistics
ISBN:9780134683416
Author:Ron Larson, Betsy Farber
Publisher:PEARSON

The Basic Practice of Statistics
Statistics
ISBN:9781319042578
Author:David S. Moore, William I. Notz, Michael A. Fligner
Publisher:W. H. Freeman

Introduction to the Practice of Statistics
Statistics
ISBN:9781319013387
Author:David S. Moore, George P. McCabe, Bruce A. Craig
Publisher:W. H. Freeman