
MATLAB: An Introduction with Applications
6th Edition
ISBN: 9781119256830
Author: Amos Gilat
Publisher: John Wiley & Sons Inc
expand_more
expand_more
format_list_bulleted
Related questions
Question
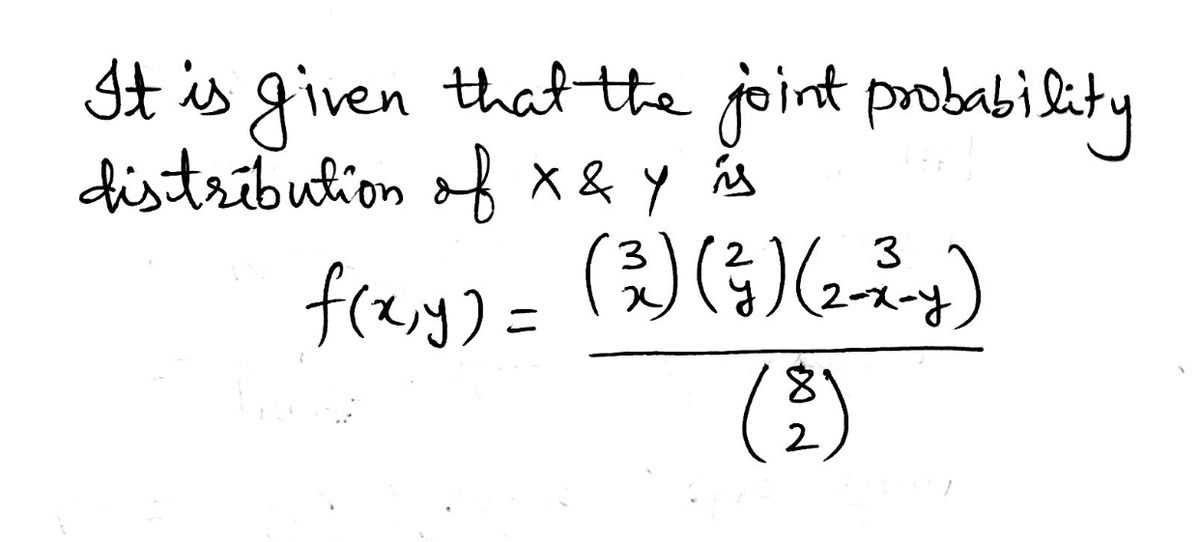
Topic: Joint probability distributions
Find and show work for:
f(1,1)
f(2,0)
f(0,0)
![96
Chapter 3 Random Variables and Probability Distributions
5, it will become clear that the joint probability distribution of Table 3.1 can
be represented by the formula
f(x, y)
Y
=
for x = 0, 1, 2; y = 0, 1, 2; and 0 ≤ x + y ≤ 2.
(b) The probability that (X, Y) fall in the region A is
P[(X, Y) € A] = P(X + Y ≤ 1) = ƒ(0,0) + ƒ(0, 1) + ƒ(1, 0)
3 3 9 9
28 14 28
14*
3
(31) (1) (2_2-y)
(8)
= + +
f(x, y)
0
1
2
Table 3.1: Joint Probability Distribution for Example 3.14
Column Totals
0
3
28
3
=
14
1
28
X
1
9
28
3
14
0
2
3
28
0
0
5
15
3
14 28 28
Row
Totals
15
28
1
28
1
When X and Y are continuous random variables, the joint density function
f(x, y) is a surface lying above the xy plane, and P[(X, Y) € A], where A is any
region in the xy plane, is equal to the volume of the right cylinder bounded by the
base A and the surface.](https://content.bartleby.com/qna-images/question/53be2c08-b5df-4492-b805-ccec7f62b780/77c67ef1-9470-42e9-9ee0-5a57375f6589/0xt50eb_processed.png)

Transcribed Image Text:96
Chapter 3 Random Variables and Probability Distributions
5, it will become clear that the joint probability distribution of Table 3.1 can
be represented by the formula
f(x, y)
Y
=
for x = 0, 1, 2; y = 0, 1, 2; and 0 ≤ x + y ≤ 2.
(b) The probability that (X, Y) fall in the region A is
P[(X, Y) € A] = P(X + Y ≤ 1) = ƒ(0,0) + ƒ(0, 1) + ƒ(1, 0)
3 3 9 9
28 14 28
14*
3
(31) (1) (2_2-y)
(8)
= + +
f(x, y)
0
1
2
Table 3.1: Joint Probability Distribution for Example 3.14
Column Totals
0
3
28
3
=
14
1
28
X
1
9
28
3
14
0
2
3
28
0
0
5
15
3
14 28 28
Row
Totals
15
28
1
28
1
When X and Y are continuous random variables, the joint density function
f(x, y) is a surface lying above the xy plane, and P[(X, Y) € A], where A is any
region in the xy plane, is equal to the volume of the right cylinder bounded by the
base A and the surface.
Expert Solution
arrow_forward
Step 1

Trending nowThis is a popular solution!

Step by stepSolved in 3 steps with 3 images

Knowledge Booster

Similar questions
- Statistics for CSarrow_forwardRequired information In a certain community, levels of air pollution may exceed federal standards for ozone or for particulate matter on some days. For a particular summer season, let X be the number of days on which the ozone standard is exceeded and let y be the number of days on which the particulate matter standard is exceeded. Assume that the joint probability mass function of X and Y is given in the following table: X 0 1 2 0 0.10 0.17 0.06 y 1 0.11 0.23 0.14 2 0.05 0.08 0.06 Find P(X= 1 and Y=0). (Round the final answer to two decimal places.)arrow_forward
arrow_back_ios
arrow_forward_ios
Recommended textbooks for you
- MATLAB: An Introduction with ApplicationsStatisticsISBN:9781119256830Author:Amos GilatPublisher:John Wiley & Sons Inc
 Probability and Statistics for Engineering and th...StatisticsISBN:9781305251809Author:Jay L. DevorePublisher:Cengage Learning
 Statistics for The Behavioral Sciences (MindTap C...StatisticsISBN:9781305504912Author:Frederick J Gravetter, Larry B. WallnauPublisher:Cengage Learning
  Elementary Statistics: Picturing the World (7th E...StatisticsISBN:9780134683416Author:Ron Larson, Betsy FarberPublisher:PEARSON
 The Basic Practice of StatisticsStatisticsISBN:9781319042578Author:David S. Moore, William I. Notz, Michael A. FlignerPublisher:W. H. Freeman
 Introduction to the Practice of StatisticsStatisticsISBN:9781319013387Author:David S. Moore, George P. McCabe, Bruce A. CraigPublisher:W. H. Freeman
MATLAB: An Introduction with Applications
Statistics
ISBN:9781119256830
Author:Amos Gilat
Publisher:John Wiley & Sons Inc
Probability and Statistics for Engineering and th...
Statistics
ISBN:9781305251809
Author:Jay L. Devore
Publisher:Cengage Learning
Statistics for The Behavioral Sciences (MindTap C...
Statistics
ISBN:9781305504912
Author:Frederick J Gravetter, Larry B. Wallnau
Publisher:Cengage Learning
Elementary Statistics: Picturing the World (7th E...
Statistics
ISBN:9780134683416
Author:Ron Larson, Betsy Farber
Publisher:PEARSON
The Basic Practice of Statistics
Statistics
ISBN:9781319042578
Author:David S. Moore, William I. Notz, Michael A. Fligner
Publisher:W. H. Freeman
Introduction to the Practice of Statistics
Statistics
ISBN:9781319013387
Author:David S. Moore, George P. McCabe, Bruce A. Craig
Publisher:W. H. Freeman