
ENGR.ECONOMIC ANALYSIS
14th Edition
ISBN: 9780190931919
Author: NEWNAN
Publisher: Oxford University Press
expand_more
expand_more
format_list_bulleted
Related questions
Question

Transcribed Image Text:11. Applying the AD-AS model
Aa Aa
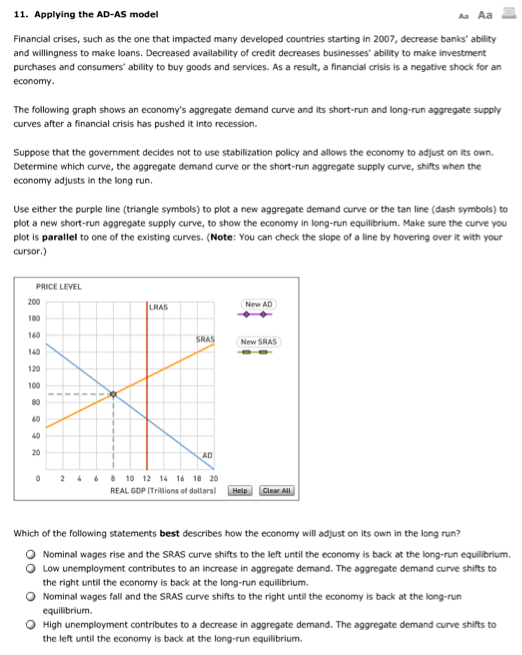
Financial crises, such as the one that impacted many developed countries starting in 2007, decrease banks' ability
and willingness to make loans. Decreased availability of credit decreases businesses' ability to make investment
purchases and consumers' ability to buy goods and services. As a result, a financial crisis is a negative shock for an
economy.
The following graph shows an economy's aggregate demand curve and its short-run and long-run aggregate supply
curves after a financial crisis has pushed it into recession.
Suppose that the government decides not to use stabilization policy and allows the economy to adjust on its own.
Determine which curve, the aggregate demand curve or the short-run aggregate supply curve, shifts when the
economy adjusts in the long run.
Use either the purple line (triangle symbols) to plot a new aggregate demand curve or the tan line (dash symbols) to
plot a new short-run aggregate supply curve, to show the economy in long-run equilibrium. Make sure the curve you
plot is parallel to one of the existing curves. (Note: You can check the slope of a line by hovering over it with your
cursor.)
PRICE LEVEL
200
LRAS
180
160
140
120
100
80
60
40
20
New AD
SRAS
New SRAS
AD
°
2
6 8 10 12 14 16 18 20
REAL GDP (Trillions of dollars)
Help
Clear All
Which of the following statements best describes how the economy will adjust on its own in the long run?
Nominal wages rise and the SRAS curve shifts to the left until the economy is back at the long-run equilibrium.
Low unemployment contributes to an increase in aggregate demand. The aggregate demand curve shifts to
the right until the economy is back at the long-run equilibrium.
Nominal wages fall and the SRAS curve shifts to the right until the economy is back at the long-run
equilibrium.
High unemployment contributes to a decrease in aggregate demand. The aggregate demand curve shifts to
the left until the economy is back at the long-run equilibrium.
Expert Solution
This question has been solved!
Explore an expertly crafted, step-by-step solution for a thorough understanding of key concepts.

Step by stepSolved in 5 steps with 2 images

Knowledge Booster


Learn more about
Need a deep-dive on the concept behind this application? Look no further. Learn more about this topic, economics and related others by exploring similar questions and additional content below.Similar questions
- Question: A recent article (federalreserve.gov/econres/feds/files/2020049pap.pdf) published by the Federal Reserve (the central bank of the USA), suggests "the massive lockdown of the economy" has led to "a large negative demand shock. However, an accompanying increase in unemployment benefits has increased the income of some low-and middle-income households at least temporarily, which could helpfully support aggregate demand". The excerpt above suggests an increase in household income, which might lead to improved aggregate demand. a. Draw a diagram to explain the above situation to show the impact of increased income and how it affects aggregate demand.arrow_forwardStart with a brief introduction that explains use of Government policy to control the economy. When is it appropriate to use monetary and fiscal policy to stimulate or stabilize the economy? Look at both. When is it inappropriate to use monetary and fiscal policy to stimulate or stabilize the economy? Look at both. What specific fiscal policy tools would you use to stimulate aggregate demand and how? What specific monetary policy tools would you use to stimulate aggregate demand and how? What is your conclusion, should policymakers use the monetary and or fiscal policy, or a combination of both, to stimulate aggregate demand? Explain your reasoning.arrow_forwardThe following graph shows the economy in long-run equilibrium at the expected price level of 120 and the natural level of output of $600 billion. Suppose a stock market boom increases household wealth and causes consumers to spend more. Shift the short-run aggregate supply (AS) curve or the aggregate demand (AD) curve to show the short-run impact of the stock market boom. 240 AS 200 AD 160 AS 120 80 AD 40 200 400 600 800 1000 1200 OUTPUT (Billions of dollars) In the short run, the increase in consumption spending associated with the stock market expansion causes the price level to the price level people expected and the quantity of output to the natural level of output. The stock market boom will cause the unemployment rate to the natural rate of unemployment in the short run. Again, the following graph shows the economy in long-run equilibrium at the expected price level of 120 and the natural level of output of $600 billion, before the increase in consumption spending associated with…arrow_forward
- 6arrow_forwardConsider an economy currently in recession. Which is NOT a policy move that could assist the economy, as discussed in class? Raising the money supply Raising government spending Lowering bank reserves Lowering interest ratesarrow_forwardSuppose the economy is currently in equilibrium, with unemployment equal to the natural rate, and that people form expectations rationally. If the Federal Reserve announces that it is going to decrease the money supply, then: the economy will move to a lower price level but remain at potential GDP. the economy will permanently move to a higher level of output and a higher price level. the economy will permanently move to a lower level of output and a lower price level. the economy will move to a higher GDP level but remain at a constant price level.arrow_forward
- Suppose that the following equations represent an entire economy. What size output shock will send the economy into a liquidity trap? t = y0.5 (r - 3%) r = 2% + (πt - 2%) + 2.9t πt = 2% + tarrow_forwardThe last personal savings rate recorded by the Federal Reserve database was 2.4%. Assume your average tax rate is 35%. The Federal Government recently spent $1.2T on “infrastructure”. Assuming this stands, answer the following question. 1. How much disposable income would the third iteration of this spending generate? 1.1A. What is the estimated increase in aggregate demand as a result of this bill assuming no tax increase?arrow_forwardIn order to stimulate the sagging European economy, the European Central Bank (ECB) decides to engage in expansionary monetary policy. Your job as one of the advisors to the ECB is to explain to the public what this policy expects to accomplish. Using a short run aggregate supply and aggregate demand graph, illustrate what happens to the overall economy as a result of this monetary policy. Which curve shifts? What happens to the following (up, down, stay the same): Output: Employment: Price levels:arrow_forward
- Question 76 During the 2020 campaign, Joe Biden proposed raising income taxes on those earning more than $400,000 per year and raising corporate taxes from about 21 percent to 28 percent. Consider the aggregate demand-aggregate supply diagram below, which represents the macroeconomy. Suppose the market is initially at an equilibrium at point A. What effect will a tax increase have on this graph? Question 76 options: 1.The long-run aggregate supply curve will shift to the left. 2.The aggregate demand curve will shift to the right. 3.The aggregate demand curve will shift to the left. 4.The short-run aggregate supply curve will shift to the left. Question 77 During the 2020 campaign, Joe Biden proposed raising income taxes on those earning more than $400,000 per year and raising corporate taxes from about 21 percent to 28 percent. Consider the market for money illustrated in the figure below. Assume the market initially is in equilibrium at point A. What effect will the tax increase…arrow_forward8arrow_forwardBriefly explain how each of the following events would affect the aggregate demand curve a) an increase in the price level b) an increase in government purchases c) higher federal corporate income taxesarrow_forward
arrow_back_ios
SEE MORE QUESTIONS
arrow_forward_ios
Recommended textbooks for you
 Principles of Economics (12th Edition)EconomicsISBN:9780134078779Author:Karl E. Case, Ray C. Fair, Sharon E. OsterPublisher:PEARSON
 Engineering Economy (17th Edition)EconomicsISBN:9780134870069Author:William G. Sullivan, Elin M. Wicks, C. Patrick KoellingPublisher:PEARSON
 Principles of Economics (MindTap Course List)EconomicsISBN:9781305585126Author:N. Gregory MankiwPublisher:Cengage Learning
 Managerial Economics: A Problem Solving ApproachEconomicsISBN:9781337106665Author:Luke M. Froeb, Brian T. McCann, Michael R. Ward, Mike ShorPublisher:Cengage Learning
 Managerial Economics & Business Strategy (Mcgraw-...EconomicsISBN:9781259290619Author:Michael Baye, Jeff PrincePublisher:McGraw-Hill Education
Principles of Economics (12th Edition)
Economics
ISBN:9780134078779
Author:Karl E. Case, Ray C. Fair, Sharon E. Oster
Publisher:PEARSON
Engineering Economy (17th Edition)
Economics
ISBN:9780134870069
Author:William G. Sullivan, Elin M. Wicks, C. Patrick Koelling
Publisher:PEARSON
Principles of Economics (MindTap Course List)
Economics
ISBN:9781305585126
Author:N. Gregory Mankiw
Publisher:Cengage Learning
Managerial Economics: A Problem Solving Approach
Economics
ISBN:9781337106665
Author:Luke M. Froeb, Brian T. McCann, Michael R. Ward, Mike Shor
Publisher:Cengage Learning
Managerial Economics & Business Strategy (Mcgraw-...
Economics
ISBN:9781259290619
Author:Michael Baye, Jeff Prince
Publisher:McGraw-Hill Education