
ENGR.ECONOMIC ANALYSIS
14th Edition
ISBN: 9780190931919
Author: NEWNAN
Publisher: Oxford University Press
expand_more
expand_more
format_list_bulleted
Related questions
Question
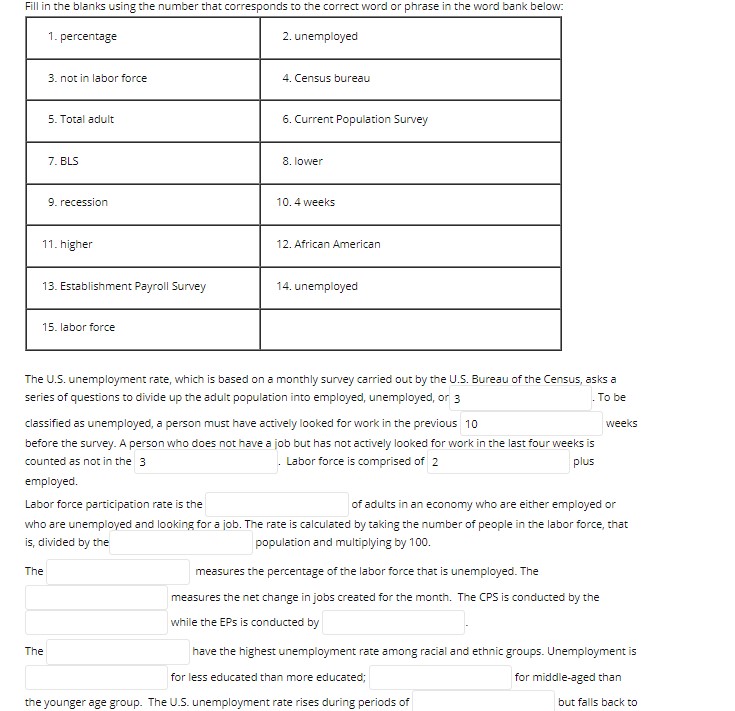

Transcribed Image Text:Fill in the blanks using the number that corresponds to the correct word or phrase in the word bank below:
1. percentage
2. unemployed
3. not in labor force
4. Census bureau
6. Current Population Survey
5. Total adult
7. BLS
8. lower
9. recession
10.4 weeks
11. higher
12. African American
13. Establishment Payroll Survey
14. unemployed
15. labor force
The U.S. unemployment rate, which is based on a monthly survey carried out by the U.S. Bureau of the Census, asks a
series of questions to divide up the adult population into employed, unemployed, or 3
To be
classified as unemployed, a person must have actively looked for work in the previous 10
weeks
before the survey. A person who does not have a job but has not actively looked for work in the last four weeks is
. Labor force is comprised of 2
counted as not in the 3
plus
employed.
Labor force participation rate is the
of adults in an economy who are either employed or
who are unemployed and looking for a job. The rate is calculated by taking the number of people in the labor force, that
is, divided by the
population and multiplying by 100.
The
measures the percentage of the labor force that is unemployed. The
measures the net change in jobs created for the month. The CPS is conducted by the
while the EPs is conducted by
The
have the highest unemployment rate among racial and ethnic groups. Unemployment is
for less educated than more educated;
for middle-aged than
the younger age group. The U.S. unemployment rate rises during periods of
but falls back to
Expert Solution
This question has been solved!
Explore an expertly crafted, step-by-step solution for a thorough understanding of key concepts.

This is a popular solution

Trending nowThis is a popular solution!

Step by stepSolved in 2 steps

Knowledge Booster


Learn more about
Need a deep-dive on the concept behind this application? Look no further. Learn more about this topic, economics and related others by exploring similar questions and additional content below.Similar questions
- Month CPI January 281.93 February 284.18 March 287.71 April 288.66 The minimum wage was $1.60 in 1968. The CPI in December of 1968 was 35.6 and we have the data above for CPI values in 2022. What is the value of the 1968 minimum wage in April 2022 terms? Round your answer to two digits after the decimal without the dollar sign. Make sure you are using the correct base period.arrow_forwardQuestion 2arrow_forwardSection 3: Inflation and Unemployment The labour market Fill in the missing data in the table illustrating some labor market data for New-England Explain how the missing data was received. Data Type Working age population (x 1 000) Inactive population (x 1000) Active population (x 1 000) Employed (x 1 000) Unemployed (x 1 000) Unemployment rate (%) Activity rate (%) Employment rate (%) T1 2013 28476.9 66.6 61.8 T2 2013 28566.1 7.1 66.5 T3 2013 28667.9 9616.8 19051.1 17698.8 1352.3 7.1 66.5 61.7 T4 2013 28757.7 9681.9 19075.8 17735.3 1340.6 7 66.3 61.7 T1 2014 9737 17748.3 61.5 T2 2014 28912 9812.2 19099.8 17762 1337.7 7 66.1 61.4 T3 2014 29001.8 9868.1 19133.7 17791.7 1342 7 66 61.3 T4 2014 29073.7 1290.9 6.7 T1 2015 29138.7 9983 19155.7 17873.1 1282.5 6.7 65.7…arrow_forward
- Household Employment Data (Numbers in billions) Working age Population Labor Force Employed Unemployed October 2019 259.8 164.4 158.5 5.8 July 2020 260.4 159.9 143.5 17.8 October 2020 260.9 160.9 149.8 11.1 Source: https://www.bls.gov/news.release/empsit.t01.htm Let’s calculate labor force participation and the unemployment rate for October 2019. X 100 Labor Force Participation Rate = People in the Labor Force Total Working Age Population X 100 = 164.4 259.8 = 0.6327 X 100 = 63.3% X 100 Unemployment Rate = Unemployed People X 100 Total Labor Force = 5.8 164.4 = 0.0353 X…arrow_forwardLabor Force of an Economy Labor Force Number of People (millions) Employed 194.1 Structurally unemployed 5.3 Cyclically unemployed 4.1 Frictionally unemployed 4.1arrow_forwardTotal number of people who are currently working full time or part time a- labor force partition b- unemployment c- employment d- labor forcearrow_forward
arrow_back_ios
arrow_forward_ios
Recommended textbooks for you
 Principles of Economics (12th Edition)EconomicsISBN:9780134078779Author:Karl E. Case, Ray C. Fair, Sharon E. OsterPublisher:PEARSON
 Engineering Economy (17th Edition)EconomicsISBN:9780134870069Author:William G. Sullivan, Elin M. Wicks, C. Patrick KoellingPublisher:PEARSON
 Principles of Economics (MindTap Course List)EconomicsISBN:9781305585126Author:N. Gregory MankiwPublisher:Cengage Learning
 Managerial Economics: A Problem Solving ApproachEconomicsISBN:9781337106665Author:Luke M. Froeb, Brian T. McCann, Michael R. Ward, Mike ShorPublisher:Cengage Learning
 Managerial Economics & Business Strategy (Mcgraw-...EconomicsISBN:9781259290619Author:Michael Baye, Jeff PrincePublisher:McGraw-Hill Education
Principles of Economics (12th Edition)
Economics
ISBN:9780134078779
Author:Karl E. Case, Ray C. Fair, Sharon E. Oster
Publisher:PEARSON
Engineering Economy (17th Edition)
Economics
ISBN:9780134870069
Author:William G. Sullivan, Elin M. Wicks, C. Patrick Koelling
Publisher:PEARSON
Principles of Economics (MindTap Course List)
Economics
ISBN:9781305585126
Author:N. Gregory Mankiw
Publisher:Cengage Learning
Managerial Economics: A Problem Solving Approach
Economics
ISBN:9781337106665
Author:Luke M. Froeb, Brian T. McCann, Michael R. Ward, Mike Shor
Publisher:Cengage Learning
Managerial Economics & Business Strategy (Mcgraw-...
Economics
ISBN:9781259290619
Author:Michael Baye, Jeff Prince
Publisher:McGraw-Hill Education