ENGR.ECONOMIC ANALYSIS
14th Edition
ISBN: 9780190931919
Author: NEWNAN
Publisher: Oxford University Press
expand_more
expand_more
format_list_bulleted
Question

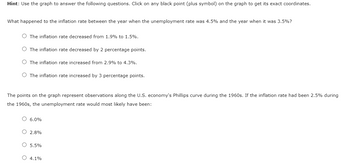
Transcribed Image Text:Hint: Use the graph to answer the following questions. Click on any black point (plus symbol) on the graph to get its exact coordinates.
What happened to the inflation rate between the year when the unemployment rate was 4.5% and the year when it was 3.5%?
O The inflation rate decreased from 1.9% to 1.5%.
O The inflation rate decreased by 2 percentage points.
The inflation rate increased from 2.9% to 4.3%.
O The inflation rate increased by 3 percentage points.
The points on the graph represent observations along the U.S. economy's Phillips curve during the 1960s. If the inflation rate had been 2.5% during
the 1960s, the unemployment rate would most likely have been:
O 6.0%
O 2.8%
O 5.5%
O 4.1%

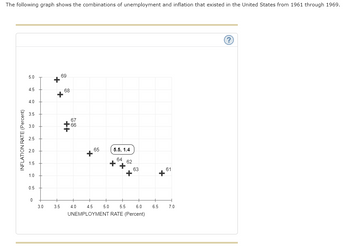
Transcribed Image Text:The following graph shows the combinations of unemployment and inflation that existed in the United States from 1961 through 1969.
NFLATION RATE (Percent)
5.0
4.5
4.0
3.5
2.5
2.0
1.5
1.0
0.5
0
3.0
*
3.5
69
68
++
67
66
*65
5.5, 1.4
64
+ 62
+
5.0
+
63
4.0 4.5
5.5
6.0
UNEMPLOYMENT RATE (Percent)
61
+
6.5
7.0
Expert Solution
This question has been solved!
Explore an expertly crafted, step-by-step solution for a thorough understanding of key concepts.
This is a popular solution
Trending nowThis is a popular solution!
Step by stepSolved in 3 steps

Knowledge Booster
Learn more about
Need a deep-dive on the concept behind this application? Look no further. Learn more about this topic, economics and related others by exploring similar questions and additional content below.Similar questions
- 40arrow_forwardGive proper explanation and solve all parts will definitely upvote. Hand written solution is not allowed.arrow_forwardConsider the labor market Phillips curve. A negative supply shock will cause O a movement to the left along O a movement to the right along O a left shift of O a right shift of the labor market Phillips curve.arrow_forward
- 81arrow_forwardYou are given the following information about the economy: the nominal interest rate = 8 percent; the real rate of interest = 6 percent. The inflation premium is Multiple Choice O 2 percent. O 8 percent. 6 percent. O O 14 percent. MacBook Pro % 95 74 Q $ #3 M 66 E R T & 27 Y * 8 U A ll 61 0arrow_forwardQuestion 2 The GDP deflator in year 4 is 120 and the GDP deflator in year 5 is 130. The rate of inflation between years 4 and 5 is O -10%. O 7.7%. O 8.33%. O 10%.arrow_forward
- 2. The inflation-unemployment relationship The following graph shows the combinations of unemployment and inflation that existed in the United States for selected years between 1961 and 1969. Click on any blue point (circle symbol) on the graph to get its exact coordinates. You can also use the black point (cross symbol) to find the coordinates of other points along the curve. (Note: You will not be graded for any adjustments made to the graph.) INFLATION RATE (Percent) 1969 5.2 4.5 1988 85 1967 20 1.5 10 0.5 1960 1984 1963 1981 0 2.0 3.5 40 4.5 5.0 5.5 GO 4.5 7.0 UNEMPLOYMENT RATE (Percent)arrow_forwardQUESTION 20 Table: The table below is for an imaginary economy of Orangeland where a typical consumer basket consists of 2 blankets and 10 coffees. Price of a Price of a Year Blanket Coffee 2017 $40 $3 2018 $45 $4 2019 $50 $5 Refer to Table. If the base year is 2018, then the economy's inflation rate in 2019 was O a. 15.38 percent. O b. 13.98 percent. Oc. 25.00 percent. O d. 20.00 percent.arrow_forwardRate Inflation 7 6 5 4 N 1 0 -1 -2 -3 0 De graph below depicts a short-run Phillips Curve. Move the line as needed to depict a long-run Phillips curve, then answer the question to the right. O 1 2 3 4 5 6 7 Unemployment Rate 8 9 10 The relationship between inflation and unemployment in the short run is different from their relationship in the long run. Which of the following is an important factor in that difference? Inflation Expectations Tax Rates Price Levels Okun's Lawarrow_forward
- Sheamous loses his job and decides to sit on the beach rather than look for work during the next few months.Other things the same, the unemployment rate Select one: O a. and the labor-force participation rate are both unaffected. O b. is unaffected and the labor-force participation rate decreases. O c. increases and the labor-force participation rate decreases. O d. increases and the labor-force participation rate is unaffected.arrow_forwardIf the input cost adjustment process works very slowly so that actual output differs from potential output for a long period of time, then None of the answers is correct O b. Active stabilization policies are probably not justified O c. Active stabilization policies are likely to create hyper-inflation O d. Active stabilization policy may widen the output gap even furtherarrow_forwardInflation VPC Y = £200 billion Output Figure 12 Current and equilibrium output In Figure 12 the economy's current output is £200 billion and the equilibrium level of output is shown by the position of the Vertical Phillips Curve (VPC). Which of the following policies could be adopted to achieve a zero output gap? (Choose one or more answers.) Select one or more: O A. An increase in income tax. O B. A quantitative easing initiative. O C. An increase in interest rates. O D. A cut in Value Added Tax. MacBook DII DD F9 000 000 F8 F7 F6 F4 F5arrow_forward
arrow_back_ios
arrow_forward_ios
Recommended textbooks for you

 Principles of Economics (12th Edition)EconomicsISBN:9780134078779Author:Karl E. Case, Ray C. Fair, Sharon E. OsterPublisher:PEARSON
 Engineering Economy (17th Edition)EconomicsISBN:9780134870069Author:William G. Sullivan, Elin M. Wicks, C. Patrick KoellingPublisher:PEARSON
 Principles of Economics (MindTap Course List)EconomicsISBN:9781305585126Author:N. Gregory MankiwPublisher:Cengage Learning
 Managerial Economics: A Problem Solving ApproachEconomicsISBN:9781337106665Author:Luke M. Froeb, Brian T. McCann, Michael R. Ward, Mike ShorPublisher:Cengage Learning
 Managerial Economics & Business Strategy (Mcgraw-...EconomicsISBN:9781259290619Author:Michael Baye, Jeff PrincePublisher:McGraw-Hill Education


Principles of Economics (12th Edition)
Economics
ISBN:9780134078779
Author:Karl E. Case, Ray C. Fair, Sharon E. Oster
Publisher:PEARSON

Engineering Economy (17th Edition)
Economics
ISBN:9780134870069
Author:William G. Sullivan, Elin M. Wicks, C. Patrick Koelling
Publisher:PEARSON

Principles of Economics (MindTap Course List)
Economics
ISBN:9781305585126
Author:N. Gregory Mankiw
Publisher:Cengage Learning

Managerial Economics: A Problem Solving Approach
Economics
ISBN:9781337106665
Author:Luke M. Froeb, Brian T. McCann, Michael R. Ward, Mike Shor
Publisher:Cengage Learning

Managerial Economics & Business Strategy (Mcgraw-...
Economics
ISBN:9781259290619
Author:Michael Baye, Jeff Prince
Publisher:McGraw-Hill Education