ENGR.ECONOMIC ANALYSIS
14th Edition
ISBN: 9780190931919
Author: NEWNAN
Publisher: Oxford University Press
expand_more
expand_more
format_list_bulleted
Question

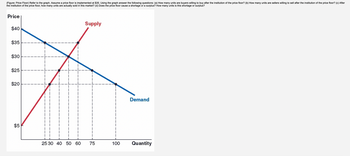
Transcribed Image Text:(Figure: Price Floor) Refer to the graph. Assume a price floor is implemented at $35. Using the graph answer the following questions: (a) How many units are buyers willing to buy after the institution of the price floor? (b) How many units are sellers willing to sell after the institution of the price floor? (c) After
the institution of the price floor, how many units are actually sold in this market? (d) Does the price floor cause a shortage or a surplus? How many units is this shortage or surplus?
Price
$40
$35
$30
$25
$20
$5
25 30 40 50 60
Supply
75
100
Demand
Quantity
Expert Solution
This question has been solved!
Explore an expertly crafted, step-by-step solution for a thorough understanding of key concepts.
This is a popular solution
Trending nowThis is a popular solution!
Step by stepSolved in 2 steps with 1 images

Knowledge Booster
Learn more about
Need a deep-dive on the concept behind this application? Look no further. Learn more about this topic, economics and related others by exploring similar questions and additional content below.Similar questions
- Demand for cookies is of the following form: P=20-4QD, where QD is millions of cookies demanded per year and P is price in US dollars. Supply of cookies of the following form: P=6+Qs, where QS is millions of cookies supplied per year and P is price in US dollars. a. What is the equilibrium quantity of cookies traded? Solve the equation, showing your work. b. Graph the supply and demand curves, marking their intersection. Be sure to label intercepts, equilibrium, etc. c. The government imposes a tax of $2 per cookie on producers of cookies. What is the new equilibrium quantity of cookies traded? Solve the equation, showing your work. d. In a graph, show how the supply curve has shifted. What price do consumers now pay? After paying the tax, how much to producers receive.arrow_forwardThe market for pizza has the following demand and supply schedules: Price (Dollars) 4 10 5 6 7 8 9 9 Quantity Demanded Quantity Supplied Į (Pizzas) 135 115 100 90 60 45 Use the blue points (circle symbol) to graph the demand for pizzas. Then use the orange points (square symbol) to graph the supply of pizza. Finally, use the black point (plus symbol) to indicate the equilibrium price and quantity in this market. (Pizzas) 15 50 75 90 100 105 ?arrow_forward10. Market equilibrium The following table shows the monthly demand and supply in the market for shoes in San Francisco. Price Quantity Demanded Quantity Supplied (Dollars per pair of shoes) (Pairs of shoes) (Pairs of shoes) 20 1,650 300 40 1,200 750 60 600 1,050 80 300 1,350 100 150 1,500 On the following graph, plot the demand for shoes using the blue point (circle symbol). Next, plot the supply of shoes using the orange point (square symbol). Finally, use the black point (plus symbol) to indicate the equilibrium price and quantity in the market for shoes. Note: Plot your points in the order in which you would like them connected. Line segments will connect the points automatically. 120 100 Demand 80 Supply 60 Equilibrium 40 20 300 600 900 1200 1500 1800 QUANTITY (Pairs of shoes) PRICE (Dollars per pair of shoes)arrow_forward
- Question 1 For each of these situations for part a, b, c, answer what happens to the list below. (increase, decrease, no change) with all other things constant. In addition draw the necessary Demand and Supply graph and show the shifts. Label all points on the graphs clearly. State for each market below what happens to: demand, supply, equilibrium price, equilibrium quantity, Quantity Demanded, Quantity Supplied How will a decrease in supply of Coffee affect the market for Coffee and Tea market? Assume substitute products. You need to show two markets, with two sets of the list. ? How will an increase in cost of plastic used in making toys affect the market for toys? How will the increase' Note:- Do not provide handwritten solution. Maintain accuracy and quality in your answer. Take care of plagiarism. Answer completely. You will get up vote for sure.arrow_forwardInterpret what an increase in demand and an increase in supply mean. Discuss the causes of an increase in demand and an increase in supply. How are increases in demand and supply expressed graphically?arrow_forwardQuestion: What happens to equilibrium price and quantity in a market when there is an increase in both supply and demand? A) Equilibrium price decreases, equilibrium quantity increases B) Equilibrium price increases, equilibrium quantity decreases C) Equilibrium price and quantity both increase D) Equilibrium price and quantity both decreasearrow_forward
arrow_back_ios
arrow_forward_ios
Recommended textbooks for you

 Principles of Economics (12th Edition)EconomicsISBN:9780134078779Author:Karl E. Case, Ray C. Fair, Sharon E. OsterPublisher:PEARSON
 Engineering Economy (17th Edition)EconomicsISBN:9780134870069Author:William G. Sullivan, Elin M. Wicks, C. Patrick KoellingPublisher:PEARSON
 Principles of Economics (MindTap Course List)EconomicsISBN:9781305585126Author:N. Gregory MankiwPublisher:Cengage Learning
 Managerial Economics: A Problem Solving ApproachEconomicsISBN:9781337106665Author:Luke M. Froeb, Brian T. McCann, Michael R. Ward, Mike ShorPublisher:Cengage Learning
 Managerial Economics & Business Strategy (Mcgraw-...EconomicsISBN:9781259290619Author:Michael Baye, Jeff PrincePublisher:McGraw-Hill Education


Principles of Economics (12th Edition)
Economics
ISBN:9780134078779
Author:Karl E. Case, Ray C. Fair, Sharon E. Oster
Publisher:PEARSON

Engineering Economy (17th Edition)
Economics
ISBN:9780134870069
Author:William G. Sullivan, Elin M. Wicks, C. Patrick Koelling
Publisher:PEARSON

Principles of Economics (MindTap Course List)
Economics
ISBN:9781305585126
Author:N. Gregory Mankiw
Publisher:Cengage Learning

Managerial Economics: A Problem Solving Approach
Economics
ISBN:9781337106665
Author:Luke M. Froeb, Brian T. McCann, Michael R. Ward, Mike Shor
Publisher:Cengage Learning

Managerial Economics & Business Strategy (Mcgraw-...
Economics
ISBN:9781259290619
Author:Michael Baye, Jeff Prince
Publisher:McGraw-Hill Education