
ENGR.ECONOMIC ANALYSIS
14th Edition
ISBN: 9780190931919
Author: NEWNAN
Publisher: Oxford University Press
expand_more
expand_more
format_list_bulleted
Related questions
Question
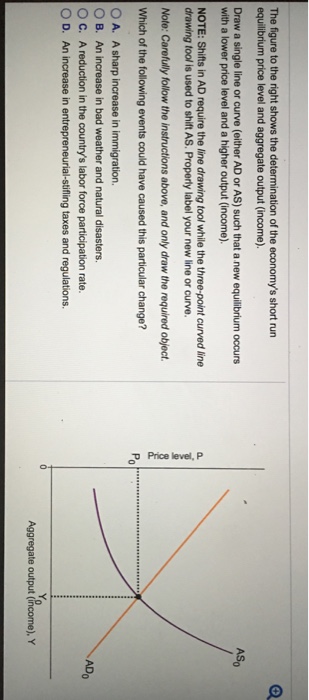

Transcribed Image Text:The figure to the right shows the determination of the economy's short run
equilibrium price level and aggregate output (income).
Draw a single line or curve (either AD or AS) such that a new equilibrium occurs
with a lower price level and a higher output (income).
NOTE: Shifts in AD require the line drawing tool while the three-point curved line
drawing tool is used to shift AS. Properly label your new line or curve.
Note: Carefully follow the instructions above, and only draw the required object.
Which of the following events could have caused this particular change?
A. A sharp increase in immigration.
B. An increase in bad weather and natural disasters.
OC. A reduction in the country's labor force participation rate.
OD. An increase in entrepreneurial-stifling taxes and regulations.
Price level, P
Aggregate output (income), Y
ASO
ADO
O
Expert Solution
This question has been solved!
Explore an expertly crafted, step-by-step solution for a thorough understanding of key concepts.

Step by stepSolved in 3 steps with 1 images

Knowledge Booster


Learn more about
Need a deep-dive on the concept behind this application? Look no further. Learn more about this topic, economics and related others by exploring similar questions and additional content below.Similar questions
- Define the terms recessionary gap and the inflationary gap. Why do they occur? Please frame your answer within the context of the COVID-19 impact in the economy.arrow_forwardHelparrow_forwardAnalyze the SR and LR impact of a rise in Taxes (T) on the economy. Note that higher Taxes affect disposable income. Assume that the economy starts in General Equilibrium. 1. Now show the impact of the fall in optimism on the IS-LM diagram and the AD-AS diagram BOTH in SR and LR. No discussion. Clearly show & label the SR impact and the LR impact in both diagrams. 2. Now use the "time diagrams", to show the impact of this shock over time on the following 2 variables: real interest rate (r) and real money demand.arrow_forward
- only typed solutionarrow_forwardOnly typed solutionarrow_forwardAssume that an economy is initially operating at the natural rate of output (full employmentoutput). Use the AD-AS model to illustrate graphically the effects on price and output of areduction in government spending. Explain your assumptions with respect to the range ofaggregate supply of your analysis.arrow_forward
- Note:- Do not provide handwritten solution. Maintain accuracy and quality in your answer. Take care of plagiarism. Answer completely. You will get up vote for sure.arrow_forwardHand written plz... I'll give you multiple upvotesarrow_forward6. Short-run equilibrium and long-run aggregate supply The following graph shows several aggregate demand and aggregate supply curves for an economy whose potential output is $5 trillion. The curves are labeled a, b, c, and d. Three points on the graph are also indicated by grey stars and labeled K, L, and M. PRICE LEVEL (CPI) 100 90 80 70 60 50 40 30 20 0 C 1 d M X a 2 3 4 5 REAL GDP (Trillions of dollars) 6 b 7 8 (?)arrow_forward
- Draw diagram of a typical IS-LMmodel and indicate the changes in all the variables on the diagram should there be an increase in aggregate expenditure causing a shift of the IS curve to the right ( indicate the shift in the IS curve on your diagram) Indicate where macroequilibrium will be and properly label the axes on the diagram. Briefly explain what you understand such an IS-LM model is actually reflecting in terms of macroeconomicsarrow_forwardConsider an economy characterized by the following equations: C = 750 +0.75Y+0.10W 1 = 150 where C is desired consumption, I is desired investment, W is household wealth, and Y is national income. a. Suppose wealth is constant at W = 10,000. Use the line drawing tool to draw and label the aggregate expenditure function on a scale diagram along with the 45° line to the right. Make sure that the line starts at y-axis and extends to the right. Carefully follow the instructions above, and only draw the required objects. Desired Aggregate Expenditures Aggregate Expenditure and Equilibrium 10,000- 9,000- 8,000- 7,000- 6,000- 5,000- 4,000- 3,000- 2,000- 1,000- 0 45 line 2,000 4,000 6,000 8,000 10, Actual National Incomearrow_forward2. Consider the following IS-LM model: C = 200+ 0.25Ya I = 150+ 0.25Y - 1000i G = 250 T = 200 d M (1) MS = 3200 and P = 2 = 2Y - 8000i a. Derive the IS relation (Y in terms of i) C. Solve for equilibrium real output. b. Derive the LM relation (Y in terms of i)arrow_forward
arrow_back_ios
SEE MORE QUESTIONS
arrow_forward_ios
Recommended textbooks for you
 Principles of Economics (12th Edition)EconomicsISBN:9780134078779Author:Karl E. Case, Ray C. Fair, Sharon E. OsterPublisher:PEARSON
 Engineering Economy (17th Edition)EconomicsISBN:9780134870069Author:William G. Sullivan, Elin M. Wicks, C. Patrick KoellingPublisher:PEARSON
 Principles of Economics (MindTap Course List)EconomicsISBN:9781305585126Author:N. Gregory MankiwPublisher:Cengage Learning
 Managerial Economics: A Problem Solving ApproachEconomicsISBN:9781337106665Author:Luke M. Froeb, Brian T. McCann, Michael R. Ward, Mike ShorPublisher:Cengage Learning
 Managerial Economics & Business Strategy (Mcgraw-...EconomicsISBN:9781259290619Author:Michael Baye, Jeff PrincePublisher:McGraw-Hill Education
Principles of Economics (12th Edition)
Economics
ISBN:9780134078779
Author:Karl E. Case, Ray C. Fair, Sharon E. Oster
Publisher:PEARSON
Engineering Economy (17th Edition)
Economics
ISBN:9780134870069
Author:William G. Sullivan, Elin M. Wicks, C. Patrick Koelling
Publisher:PEARSON
Principles of Economics (MindTap Course List)
Economics
ISBN:9781305585126
Author:N. Gregory Mankiw
Publisher:Cengage Learning
Managerial Economics: A Problem Solving Approach
Economics
ISBN:9781337106665
Author:Luke M. Froeb, Brian T. McCann, Michael R. Ward, Mike Shor
Publisher:Cengage Learning
Managerial Economics & Business Strategy (Mcgraw-...
Economics
ISBN:9781259290619
Author:Michael Baye, Jeff Prince
Publisher:McGraw-Hill Education