ENGR.ECONOMIC ANALYSIS
14th Edition
ISBN: 9780190931919
Author: NEWNAN
Publisher: Oxford University Press
expand_more
expand_more
format_list_bulleted
Question
I have attached my question as an image. If the image is too small, feel free to enlarge it or pen it in another tab.
I am curious to know the reasoning behind your approach. Thank you.

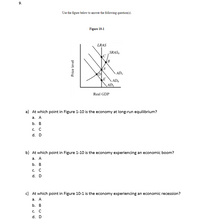
Transcribed Image Text:**Economic Equilibrium and Business Cycle Analysis**
**Use the figure below to answer the following question(s):**
**Figure 10-1**
The provided figure illustrates a graph related to the Aggregate Supply and Aggregate Demand model commonly used in macroeconomics. The vertical axis represents the Price Level, while the horizontal axis represents Real GDP (Gross Domestic Product). Several curves and points are marked on the graph:
1. **LRAS**: Long-Run Aggregate Supply curve
2. **SRAS0**: Short-Run Aggregate Supply curve
3. **AD0**: Initial Aggregate Demand curve
4. **AD1**: Increased Aggregate Demand curve
5. **AD2**: Decreased Aggregate Demand curve
The graph also highlights the following points:
- Point A
- Point B
- Point C
- Point D
### Questions:
**a) At which point in Figure 1-10 is the economy at long-run equilibrium?**
- **a. A**
- b. B
- c. C
- d. D
*Answer:* At Point A, the economy is at long-run equilibrium, where the Aggregate Demand curve intersects the Long-Run Aggregate Supply curve.
**b) At which point in Figure 1-10 is the economy experiencing an economic boom?**
- a. A
- **b. B**
- c. C
- d. D
*Answer:* At Point B, the economy is experiencing an economic boom, where Aggregate Demand has increased (AD1) and surpassed the Long-Run Aggregate Supply, likely causing higher price levels and real GDP beyond the long-run sustainable rate.
**c) At which point in Figure 10-1 is the economy experiencing an economic recession?**
- **a. A**
- b. B
- c. C
- d. D
*Answer:* At Point C, the economy is experiencing a recession, where Aggregate Demand has decreased (AD2) and is below the Long-Run Aggregate Supply, reflecting a lower price level and real GDP.
### Graph Analysis:
**Figure 10-1 Explanation:**
- **Long-Run Aggregate Supply (LRAS)** remains vertical, indicating that in the long-run, real GDP is determined by resources, technology, and institutions, and is unaffected by price level changes.
- **Short-Run Aggregate Supply (SRAS0)** can shift based on various short-term factors such as wages and raw material costs
Expert Solution
This question has been solved!
Explore an expertly crafted, step-by-step solution for a thorough understanding of key concepts.
This is a popular solution
Trending nowThis is a popular solution!
Step by stepSolved in 2 steps

Knowledge Booster
Learn more about
Need a deep-dive on the concept behind this application? Look no further. Learn more about this topic, economics and related others by exploring similar questions and additional content below.Similar questions
Recommended textbooks for you

 Principles of Economics (12th Edition)EconomicsISBN:9780134078779Author:Karl E. Case, Ray C. Fair, Sharon E. OsterPublisher:PEARSON
 Engineering Economy (17th Edition)EconomicsISBN:9780134870069Author:William G. Sullivan, Elin M. Wicks, C. Patrick KoellingPublisher:PEARSON
 Principles of Economics (MindTap Course List)EconomicsISBN:9781305585126Author:N. Gregory MankiwPublisher:Cengage Learning
 Managerial Economics: A Problem Solving ApproachEconomicsISBN:9781337106665Author:Luke M. Froeb, Brian T. McCann, Michael R. Ward, Mike ShorPublisher:Cengage Learning
 Managerial Economics & Business Strategy (Mcgraw-...EconomicsISBN:9781259290619Author:Michael Baye, Jeff PrincePublisher:McGraw-Hill Education


Principles of Economics (12th Edition)
Economics
ISBN:9780134078779
Author:Karl E. Case, Ray C. Fair, Sharon E. Oster
Publisher:PEARSON

Engineering Economy (17th Edition)
Economics
ISBN:9780134870069
Author:William G. Sullivan, Elin M. Wicks, C. Patrick Koelling
Publisher:PEARSON

Principles of Economics (MindTap Course List)
Economics
ISBN:9781305585126
Author:N. Gregory Mankiw
Publisher:Cengage Learning

Managerial Economics: A Problem Solving Approach
Economics
ISBN:9781337106665
Author:Luke M. Froeb, Brian T. McCann, Michael R. Ward, Mike Shor
Publisher:Cengage Learning

Managerial Economics & Business Strategy (Mcgraw-...
Economics
ISBN:9781259290619
Author:Michael Baye, Jeff Prince
Publisher:McGraw-Hill Education