MATLAB: An Introduction with Applications
6th Edition
ISBN: 9781119256830
Author: Amos Gilat
Publisher: John Wiley & Sons Inc
expand_more
expand_more
format_list_bulleted
Question
Finding the

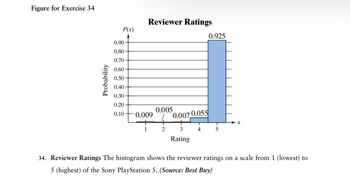
Transcribed Image Text:Figure for Exercise 34
Probability
Reviewer Ratings
P(x)
0.925
0.90
0.80
0.70
0.60
0.50-
0.40
0.30
0.20
0.005
0.10
0.009
0.007 0.055
x
1
2
3
4
5
Rating
34. Reviewer Ratings The histogram shows the reviewer ratings on a scale from 1 (lowest) to
5 (highest) of the Sony PlayStation 5. (Source: Best Buy)
Expert Solution
This question has been solved!
Explore an expertly crafted, step-by-step solution for a thorough understanding of key concepts.
Step by stepSolved in 2 steps

Knowledge Booster
Similar questions
- Scratch Off Lottery Tickets Your friend Phil, asks you what you think about a new scratch-off lottery game. It costs $10 to play this game, There are two outcomes for the game (win, lose) and the probability that a player wins a game is 60%. A win results in $15, for a net win of $5 ($15 minus the $10 paid to play). The probability distribution for x (the amount of money a player wins or loses) in a single game is as follows: Fi x > Net Money Won or Lost P(x) → Probability Win 0.60 Lose 24 0.40 Using the information in the table, complete the following 1. Interpret the table. There is a chance of winning and a chance of losing 2. What is the expected value of x? E(x) = 3. What is the standard deviation? o = (Round to then nearest hundredth). Question Source: Illustrative Mathematics https://www.illustrativemathematics.org/content- standards/HSS/MD/A/2/tasks/1217 Checkarrow_forwardCondom Failure Rate: According to the Department of Health and Human Services, the failure rate for male condoms is 18%. The accompanying table is based on the failure rate of 18%, where x represents the number of condoms that fail when six are tested. x P(x) 0 0.304 1 0.400 2 0.220 3 0.064 4 0.011 5 0.001 6 0+ Does the table describe a probability distribution? Why or Why not? Assuming that the table does describe a probability distribution, find its mean? Assuming that the table does describe a probability distribution, find its standard deviation? If 6 condoms are tested and 5 of them fail, is 5 a significantly high number of failures? Why or Why not? What does the symbol 0+ represent?arrow_forwardFind the expected value for the random variable whose probability function graph is displayed here. What is the expected value of the random variable? (Type an integer or a decimal.) 0.5- 0.4- 0.3- 0.2- 0.1- 0- 0 ♫ 2 3 4 5 1 1arrow_forward
- Both A and B pleasearrow_forwardIdentifying Probability Distributions. In Exercises 7–14, determine whether a probability distribution is given. If a probability distribution is given, find its mean and standard deviation. If a probability distribution is not given, identify the requirements that are not satisfied. Cell Phone Use In a survey, cell phone users were asked which ear they use to hear their cell phone, and the table is based on their responses (based on data from “Hemispheric Dominance and Cell Phone Use,” by Seidman et al., JAMA Otolaryngology—Head & Neck Surgery , Vol. 139, No. 5).arrow_forwardindependent activity 2: study and analyze the number off patients seen in the emergency room in any given hour is a random variable represented by x. the probability distribution for x is:arrow_forward
- Statisticsarrow_forwardExpected Value and Variance: A stock market analyst predicts the following returns for a particular stock: RETURN % PROBABILITY -10 0.2 0 0.5 10 0.3 Calculate the expected return and the variance of the returns.arrow_forwardFinding the Mean, Variance, and Standard Deviation In Exercise 30 (a) find the mean, variance, and standard deviation of the probability distribution, and (b) interpret the results.arrow_forward
arrow_back_ios
arrow_forward_ios
Recommended textbooks for you
 MATLAB: An Introduction with ApplicationsStatisticsISBN:9781119256830Author:Amos GilatPublisher:John Wiley & Sons Inc
 Probability and Statistics for Engineering and th...StatisticsISBN:9781305251809Author:Jay L. DevorePublisher:Cengage Learning
 Statistics for The Behavioral Sciences (MindTap C...StatisticsISBN:9781305504912Author:Frederick J Gravetter, Larry B. WallnauPublisher:Cengage Learning
 Elementary Statistics: Picturing the World (7th E...StatisticsISBN:9780134683416Author:Ron Larson, Betsy FarberPublisher:PEARSON
 The Basic Practice of StatisticsStatisticsISBN:9781319042578Author:David S. Moore, William I. Notz, Michael A. FlignerPublisher:W. H. Freeman
 Introduction to the Practice of StatisticsStatisticsISBN:9781319013387Author:David S. Moore, George P. McCabe, Bruce A. CraigPublisher:W. H. Freeman

MATLAB: An Introduction with Applications
Statistics
ISBN:9781119256830
Author:Amos Gilat
Publisher:John Wiley & Sons Inc

Probability and Statistics for Engineering and th...
Statistics
ISBN:9781305251809
Author:Jay L. Devore
Publisher:Cengage Learning

Statistics for The Behavioral Sciences (MindTap C...
Statistics
ISBN:9781305504912
Author:Frederick J Gravetter, Larry B. Wallnau
Publisher:Cengage Learning

Elementary Statistics: Picturing the World (7th E...
Statistics
ISBN:9780134683416
Author:Ron Larson, Betsy Farber
Publisher:PEARSON

The Basic Practice of Statistics
Statistics
ISBN:9781319042578
Author:David S. Moore, William I. Notz, Michael A. Fligner
Publisher:W. H. Freeman

Introduction to the Practice of Statistics
Statistics
ISBN:9781319013387
Author:David S. Moore, George P. McCabe, Bruce A. Craig
Publisher:W. H. Freeman