A First Course in Probability (10th Edition)
10th Edition
ISBN: 9780134753119
Author: Sheldon Ross
Publisher: PEARSON
expand_more
expand_more
format_list_bulleted
Concept explainers
Topic Video
Question
thumb_up100%

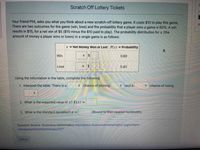
Transcribed Image Text:Scratch Off Lottery Tickets
Your friend Phil, asks you what you think about a new scratch-off lottery game. It costs $10 to play this game,
There are two outcomes for the game (win, lose) and the probability that a player wins a game is 60%. A win
results in $15, for a net win of $5 ($15 minus the $10 paid to play). The probability distribution for x (the
amount of money a player wins or loses) in a single game is as follows:
Fi
x > Net Money Won or Lost P(x) → Probability
Win
0.60
Lose
24
0.40
Using the information in the table, complete the following
1. Interpret the table. There is a
chance of winning
and a
chance of losing
2. What is the expected value of x? E(x) =
3. What is the standard deviation? o =
(Round to then nearest hundredth).
Question Source: Illustrative Mathematics https://www.illustrativemathematics.org/content-
standards/HSS/MD/A/2/tasks/1217
Check
Expert Solution
This question has been solved!
Explore an expertly crafted, step-by-step solution for a thorough understanding of key concepts.
This is a popular solution
Trending nowThis is a popular solution!
Step by stepSolved in 2 steps with 1 images

Knowledge Booster
Learn more about
Need a deep-dive on the concept behind this application? Look no further. Learn more about this topic, probability and related others by exploring similar questions and additional content below.Similar questions
- Your friend Phil, asks you what you think about a new scratch-off lottery game. It costs $10 to play this game, There are two outcomes for the game (win, lose) and the probability that a player wins a game is 60%. A win results in $15, for a net win of $5 ($15 minus the $10 paid to play). The probability distribution for x� (the amount of money a player wins or loses) in a single game is as follows:arrow_forwardA daycare provider has determined that 80% of the children in her care develop colds each winter. This year there are 40 children at the daycare. What is the probability that fewer than 30 children will develops colds this winter? Please explain. Options A. 0.2148 B. 0.2852 C. 0.5704 D. 0.4297arrow_forwardwhat is the probability of a baseball player getting three hits in a row if his batting average is 17.9%arrow_forward
arrow_back_ios
arrow_forward_ios
Recommended textbooks for you
 A First Course in Probability (10th Edition)ProbabilityISBN:9780134753119Author:Sheldon RossPublisher:PEARSON

A First Course in Probability (10th Edition)
Probability
ISBN:9780134753119
Author:Sheldon Ross
Publisher:PEARSON
