
Elements Of Electromagnetics
7th Edition
ISBN: 9780190698614
Author: Sadiku, Matthew N. O.
Publisher: Oxford University Press
expand_more
expand_more
format_list_bulleted
Related questions
Question
I’m using this code in MATLAB but for some odd reason every time I run it on MATLAB I keep on getting a different graphs. In the picture that shows two different graphs are from the same code, but I need to it to look like the picture that has one graph. Could you please fix it. To make it look like the picture that has one graph?
Here is the code:
% Sample data for Diesel and Petrol
carPosition = linspace(1, 60, 50); % Assumed positions of cars
CO2Diesel = 25 + 5*cos(carPosition/60*2*pi) + randn(1, 50)*5; % Random data for Diesel
CO2Petrol = 20 + 5*sin(carPosition/60*2*pi) + randn(1, 50)*5; % Random data for Petrol
% Fit polynomial curves
pDiesel = polyfit(carPosition, CO2Diesel, 3);
pPetrol = polyfit(carPosition, CO2Petrol, 3);
% Generate points for best fit lines
fitDiesel = polyval(pDiesel, carPosition);
fitPetrol = polyval(pPetrol, carPosition);
% Plotting the data
figure;
hold on;
scatter(carPosition, CO2Diesel, 'o', 'MarkerEdgeColor', [1 0.5 0]); % Diesel data
scatter(carPosition, CO2Petrol, 'o', 'MarkerEdgeColor', [0 0.5 1]); % Petrol data
plot(carPosition, fitDiesel, 'Color', [1 0.5 0], 'LineWidth', 2); % Diesel best fit
plot(carPosition, fitPetrol, 'Color', [0 0.5 1], 'LineWidth', 2); % Petrol best fit
% Customize the plot
xlabel('Car Position');
ylabel('CO2 Weighted Percentage');
title('Weighted CO2 Emissions');
legend('Diesel', 'Petrol', 'Diesel Best Fit', 'Petrol Best Fit');
grid on;
hold off;
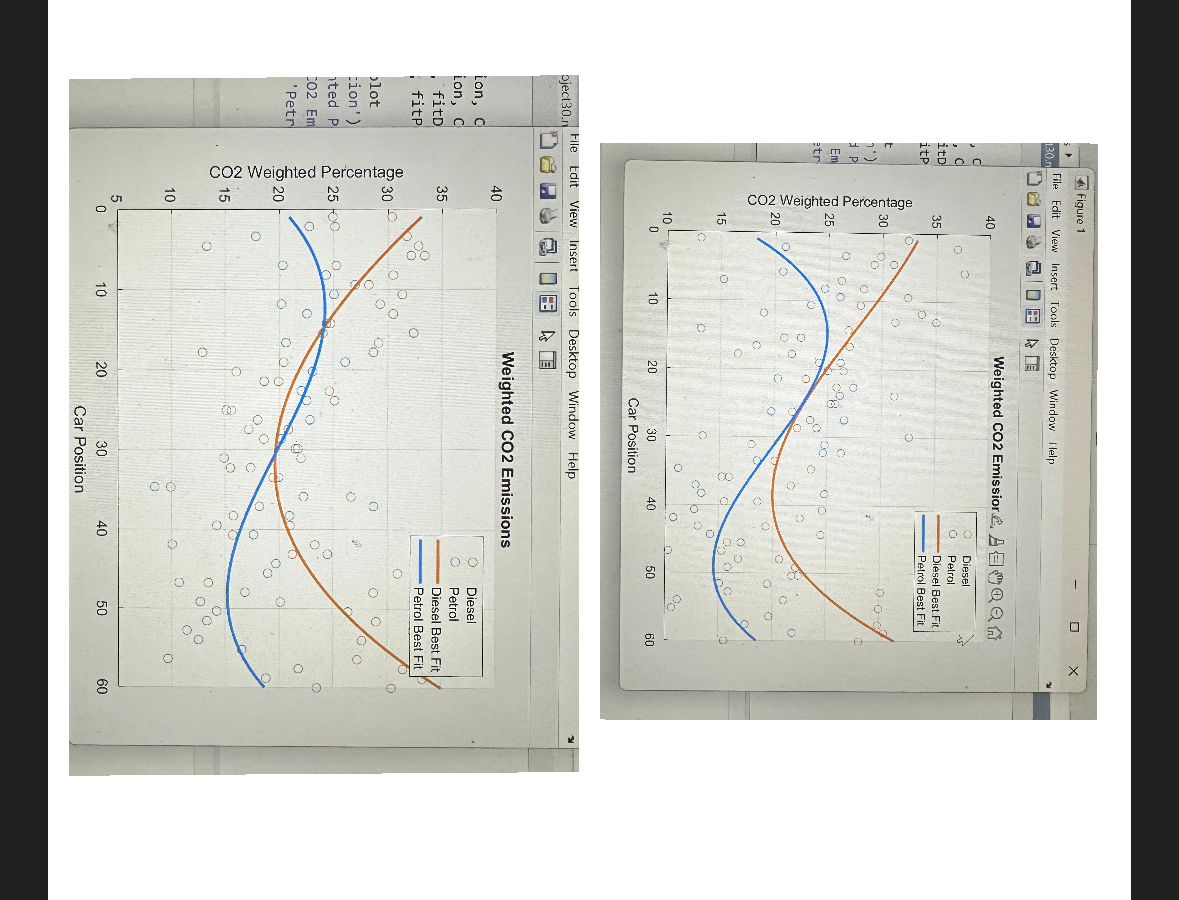

Transcribed Image Text:Figure 1
File Edit View Insert Tools Desktop Window Help
130.n
40
C
C
itD
35
itp
t
1')
P
Em
etr
CO2 Weighted Percentage
о
25
20
OX
Weighted CO2 Emissior. QQA
D
0
C
°
15
C
о
10
0
10
20
о
00
30
100
0
Car Position
File Edit View Insert
oject30.n
Tools Desktop Window Help
40
Lon, C
Lon, C
. fitD
35-
fitP
lot
tion')
ted P
CO2 Em
'Petr
CO2 Weighted Percentage.
30
2500
20
0.
15
15
10
10
5
10
10
O
Diesel
Petrol
Diesel Best Fit
Petrol Best Fit
40
50
60
Weighted CO2 Emissions
Diesel
Petrol
Diesel Best Fit
Petrol Best Fit
20
20
30
Car Position
0
40
40
о
50
60

Transcribed Image Text:50
Weighted CO2 Emmisions
50
Diesel
Petrol
10
40
30
CO2 Weighted Percentage
20
8
10
0
о
о
800
0 0
о
%
-10
0
୦୧
о
10
10
20
30
40
40
50
60
Car Position
Diesel Best Fit
Petrol Best Fit
Expert Solution
This question has been solved!
Explore an expertly crafted, step-by-step solution for a thorough understanding of key concepts.

Step by stepSolved in 2 steps

Knowledge Booster

Similar questions
- Hi I need help to make the line change into a different color, I half of the line to be orange and I need the other half of the line towards the end to be purple as shown in the picture. Also I need there be a box saying Diesel, petrol, diesel best fit, petrol best fit. This part is also shown in the graph. Please use this code and fix it in MATLAB: % Sample data for Diesel and Petrol cars carPosition = linspace(1, 60, 50); % Assumed positions of cars % Fix the random seed for reproducibility rng(50); % Assumed positions of cars CO2Diesel = 25 + 5*cos(carPosition/60*2*pi) + randn(1, 50)*5; % Random data for Diesel CO2Petrol = 20 + 5*sin(carPosition/60*2*pi) + randn(1, 50)*5; % Random data for Petrol % Fit polynomial curves pDiesel = polyfit(carPosition, CO2Diesel, 3); pPetrol = polyfit(carPosition, CO2Petrol, 3); % Generate points for best fit lines fitDiesel = polyval(pDiesel, carPosition); fitPetrol = polyval(pPetrol, carPosition); % Combine the best fit lines combinedFit =…arrow_forwardI need these three parts answered, if you are unable to answer all three parts please leave it for another tutor to answer, thank you.arrow_forwardKeep the same colors the same graph, basically keep everything the same just make the line with a small curve just as shown on the picture Keep everything the same just make the line less curvy please do not change the colors of the line and the circles do not change anything besides the curve of the line. Use this code on MATLAB and fix it. % Sample data for Diesel and Petrol cars carPosition = linspace(1, 60, 50); % Assumed positions of cars % Use the 'seed' function instead of 'rng' seed = 50; % Define your seed here rand('seed',seed); % Assumed CO2 emissions for Diesel and Petrol CO2Diesel = 25 + 5*cos(carPosition/60*2*pi) + randn(1, 50)*5; % Random data for Diesel CO2Petrol = 20 + 5*sin(carPosition/60*2*pi) + randn(1, 50)*5; % Random data for Petrol % Fit polynomial curves with a reduced degree of 2 pDiesel = polyfit(carPosition, CO2Diesel, 2); pPetrol = polyfit(carPosition, CO2Petrol, 2); % Generate points for best fit lines fitDiesel = polyval(pDiesel, carPosition);…arrow_forward
- This code keeps on generating graphs with different curves. The picture that you see two different graphs comes from the same code but both of them have different curves. I need the curve to look like the picture that only has one graph. I basically need the line to have a slight curve and every time I run the code it will come up as the same graph every time. Use this code on MATLAB and fix it % Sample data for Diesel and Petrol cars carPosition = linspace(1, 60, 50); % Assumed positions of cars % Use the 'seed' function instead of 'rng' seed = 50; % Define your seed here rand('seed',seed); % Assumed CO2 emissions for Diesel and Petrol CO2Diesel = 25 + 5*cos(carPosition/60*2*pi) + randn(1, 50)*5; % Random data for Diesel CO2Petrol = 20 + 5*sin(carPosition/60*2*pi) + randn(1, 50)*5; % Random data for Petrol % Fit polynomial curves with a reduced degree of 2 pDiesel = polyfit(carPosition, CO2Diesel, 2); pPetrol = polyfit(carPosition, CO2Petrol, 2); % Generate points for best fit…arrow_forwardEngr 215 Matlab Fahrenheit to Celsius using multiple statements Given a Fahrenheit value temperatureFahrenheit, write a statement that assigns temperatureCelsius with the equivalent Celsius value. While the equation is C = 5/9 * (F - 32), as an exercise use two statements, the first of which is "fractionalMultiplier = 5/9;"]arrow_forwardHello I’m trying to make the graph that you see in the picture, I’m trying the exact copy of that graph using this code but I’m having a hard time doing that. Could you change the code so that it looks like the graph that you see on the picture using MATLAB, please send the code when you are finished. % Sample data for Diesel and Petrol cars carPosition = linspace(1, 60, 50); % Assumed positions of cars % Fix the random seed for reproducibility rng(45); % Assumed positions of cars CO2Diesel = 25 + 5*cos(carPosition/60*2*pi) + randn(1, 50)*5; % Random data for Diesel CO2Petrol = 20 + 5*sin(carPosition/60*2*pi) + randn(1, 50)*5; % Random data for Petrol % Fit polynomial curves pDiesel = polyfit(carPosition, CO2Diesel, 3); pPetrol = polyfit(carPosition, CO2Petrol, 3); % Generate points for best fit lines fitDiesel = polyval(pDiesel, carPosition); fitPetrol = polyval(pPetrol, carPosition); % Plotting the data figure; hold on; scatter(carPosition, CO2Diesel, 'o', 'MarkerEdgeColor', [1 0.5…arrow_forward
- Don't Use Chat GPT Will Upvote And Give Handwritten Solution Pleasearrow_forwardYou are watching a jet ski race. A racer speeds up from rest to 70 mph in just a few seconds, then continues at a constant speed. Part A Select the correct basic motion diagram of the jet ski, using images from the video, from 10 s before reaching top speed until 10 s afterward. ▸ View Available Hint(s) Os =70 mph Os 4=10s = 70 mph =10s x (m) 420 s (= 20s x (m) = 70 mph OS 4,= 10s =20s x (m) Submit Provide Feedbackarrow_forwardE O ".ll Asiacell :D docs.google.com/forms Q1: Complete the pairs of sentences with the verb in brackets. Use the present simple for one and the .present continuous for the other إجابتك |-- (think) -1 of your problem. I (think) there's good solution إجابتك - (see) -2 you- What I mean? What time- you * ?(see) the film إجابتكarrow_forward
arrow_back_ios
arrow_forward_ios
Recommended textbooks for you
- Elements Of ElectromagneticsMechanical EngineeringISBN:9780190698614Author:Sadiku, Matthew N. O.Publisher:Oxford University Press
 Mechanics of Materials (10th Edition)Mechanical EngineeringISBN:9780134319650Author:Russell C. HibbelerPublisher:PEARSON
 Thermodynamics: An Engineering ApproachMechanical EngineeringISBN:9781259822674Author:Yunus A. Cengel Dr., Michael A. BolesPublisher:McGraw-Hill Education
  Control Systems EngineeringMechanical EngineeringISBN:9781118170519Author:Norman S. NisePublisher:WILEY
 Mechanics of Materials (MindTap Course List)Mechanical EngineeringISBN:9781337093347Author:Barry J. Goodno, James M. GerePublisher:Cengage Learning
 Engineering Mechanics: StaticsMechanical EngineeringISBN:9781118807330Author:James L. Meriam, L. G. Kraige, J. N. BoltonPublisher:WILEY
Elements Of Electromagnetics
Mechanical Engineering
ISBN:9780190698614
Author:Sadiku, Matthew N. O.
Publisher:Oxford University Press
Mechanics of Materials (10th Edition)
Mechanical Engineering
ISBN:9780134319650
Author:Russell C. Hibbeler
Publisher:PEARSON
Thermodynamics: An Engineering Approach
Mechanical Engineering
ISBN:9781259822674
Author:Yunus A. Cengel Dr., Michael A. Boles
Publisher:McGraw-Hill Education
Control Systems Engineering
Mechanical Engineering
ISBN:9781118170519
Author:Norman S. Nise
Publisher:WILEY
Mechanics of Materials (MindTap Course List)
Mechanical Engineering
ISBN:9781337093347
Author:Barry J. Goodno, James M. Gere
Publisher:Cengage Learning
Engineering Mechanics: Statics
Mechanical Engineering
ISBN:9781118807330
Author:James L. Meriam, L. G. Kraige, J. N. Bolton
Publisher:WILEY