A First Course in Probability (10th Edition)
10th Edition
ISBN: 9780134753119
Author: Sheldon Ross
Publisher: PEARSON
expand_more
expand_more
format_list_bulleted
Question

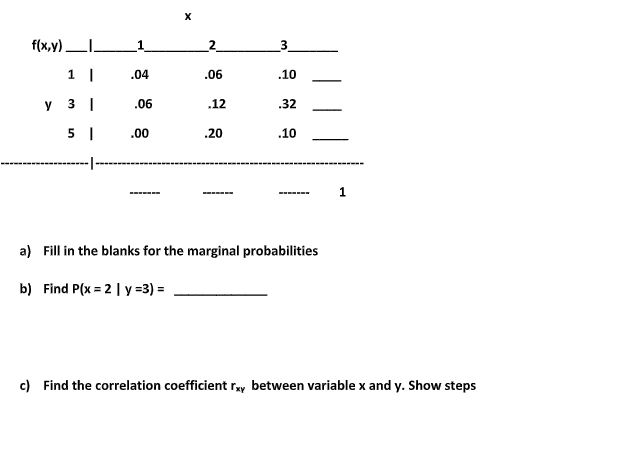
Transcribed Image Text:(Extra credit) 14. Let X denote the number of times a control machine malfunctions: 1, 2, 3 on any
given day. Let Y denote the number of times a technician is called on an emergency call. The joint
distribution of X and Y are:

Transcribed Image Text:f(x,y)LI.
_1
2_
.04
.06
.10
.06
.12
.32
.00
.20
.10
a) Fill in the blanks for the marginal probabilities
b) Find P(x = 2 | y =3) =
c) Find the correlation coefficient ray between variable x and y. Show steps
Expert Solution
This question has been solved!
Explore an expertly crafted, step-by-step solution for a thorough understanding of key concepts.
Step by stepSolved in 5 steps with 5 images

Knowledge Booster
Similar questions
- call: Researchers measured the percent 1m(formula = Symptoms - wear_mask, data - some_states) of people in 25 states who ʻknew someone with COVID symptoms' (ŷ) and regressed this on the percent of the population frequently wearing a mask in public (x). Residuals: Min -7.9167 -2.3306 -0.2469 2.5020 7. 3345 10 Median 30 Маx coefficients: (Intercept) 111.0981 wear_mask Estimate std. Error t value Pr (>|t|) 10. 5423 10. 538 2.82e-10 *** -8. 375 1. 94 e-08 *** -1.0419 0.1244 signif. codes: 0 ****' 0.001 ***' 0.01 **' 0.05 '.' 0.1 ' ' 1 Residual standard error: 3.859 on 23 degrees of freedom Multiple R-squared: 0.7531, F-statistic: 70.15 on 1 and 23 DF, p-value: 1.936e-08 Adjusted R-squared: 0.7423 If 75 percent of people in a state wear masks regularly, what % of people does this model predict will know someone with COVID symptons? 1) 32 2) 33 3) 34 4) 35arrow_forwardA correlation coefficient should be used when the independent and dependent variable are measured as categorical nominal ordinal continuousarrow_forwardThe following table was generated from the sample data of 10 newborn babies regarding the weight of the mother at birth, the weight of the father at birth, and the weight of the baby at birth. The dependent variable is the weight of the baby, the first independent variable (x)) is the mother's weight, and the second independent variable (x2) is the father's weight. Coefficients Standard Error t-Stat p-value Intercept 9.739264 1.337045 7.284173 0.000165 Mother's Weight -0.929448 0.137340 - 6.767476 0.000261 Father's Weight 0.717791 0.159475 4.500951 0.002795 Copy Data Step 1 of 2: Write the multiple regression equation for the computer output given. Round your answers to three decimal places. Answer E Tables E Keypad How to enter your answer (opens in new window) Keyboard Shortcuts X + X2arrow_forward
- What happens if the dependent variables are not correlated with each other? Will you still be able to perform MANOVA/MANCOVA?arrow_forwardfind the Empirical Relation between them. the lower and upper quartile also mention the relation betweenarrow_forwardIf S=234, S. XY = 244 S=255, then the value of correlation coefficient 'r' is XX YYarrow_forward
- COVxy = 0.14 Sx * Sy = 0.22 Please calculate the correlation coefficientarrow_forwardQ2) The following data represents the results of an experimental test, if the relation between variables take the form y=ae^(bvx) y = aeb√x y 4 13 7 10 12 9 15 7 24 4 the value of y (1 :when x=16 is 6.3278 6.2387 6.3728 6.2783 none of all above * the correlation coefficient (2 of the above relation 0.9927 0.9727 0.9772 0.9977 none of all abovearrow_forwardThere is a relation between the following variables as y = 1 / (a * x ^ b) (x ^ b means x over b) a) Calculate the correlation coefficient and interpret the degree of the relationship? b) Estimate the y-value for x = 4.3 and the x-value for y = 0.90 by obtaining the regression equationarrow_forward
- mean of x = 2.882, standard deviation = 1.634 Mean of y = 2.588, standard deviation = 0.246 The correlation coefficient is 0.159 slope coefficient for regression line = .0239 Find the intercept for the regression line.arrow_forwardGiven the data as shown in the table below X Y 56 0.86 44 0.93 68 0.85 76 0.87 94 0.73 a) Assuming the correlation coefficient of � and � is found to be -0.897995, calculate the slope, �, and y-intercept, �, of the "Best-Fit" line �^=��^+�. Use 4 decimal places for each of �¯, �¯, ��, and �� values obtained from your calculator. Round your answer to 4 decimal places.�= .�= .b) Using the equation of the "Best-Fit" line to predict the value of � when �= 60. Enter your answer in 4 decimal places.�^= .c) Using the equation of the "Best-Fit" line to predict the value of � when �= 0.89. Enter your answer in 4 decimal places.�^= .arrow_forwardThere is a relationship between the following variables as y = 1 / (a * x ^ b) (x ^ b: means x over b). a) Calculate the correlation coefficient and interpret the degree of the relationship? b) Estimate the y value for x = 4.3 and the x value for y = 0.90 by obtaining the regression equation. x 1.2 1.5 2.0 3.0 4.0 5.0 y 0.58 0.50 0.32 0.18 0.15 0.10 x 1.2 1.5 2.0 3.0 4.0 5.0 y 0.58 0.50 0.32 0.18 0.15 0.10arrow_forward
arrow_back_ios
SEE MORE QUESTIONS
arrow_forward_ios
Recommended textbooks for you
 A First Course in Probability (10th Edition)ProbabilityISBN:9780134753119Author:Sheldon RossPublisher:PEARSON

A First Course in Probability (10th Edition)
Probability
ISBN:9780134753119
Author:Sheldon Ross
Publisher:PEARSON
