MATLAB: An Introduction with Applications
6th Edition
ISBN: 9781119256830
Author: Amos Gilat
Publisher: John Wiley & Sons Inc
expand_more
expand_more
format_list_bulleted
Concept explainers
Question

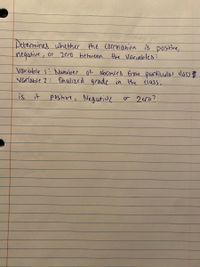
Transcribed Image Text:Determines whether the correlation is positine,
negutive
or 2ero between the Variables:
voriable 1: Number Of absences from particulas dass
Variable 2: fihulized grade in the eluss.
is it positive, Negutive
or 2cr0?
Expert Solution
This question has been solved!
Explore an expertly crafted, step-by-step solution for a thorough understanding of key concepts.
Step by stepSolved in 2 steps

Knowledge Booster
Learn more about
Need a deep-dive on the concept behind this application? Look no further. Learn more about this topic, statistics and related others by exploring similar questions and additional content below.Similar questions
- Use the standard normal table to find the z-score that corresponds to the cumulative area 0.0838. If the area is not in the table, use the entry closest to the area. If the area is halfway between two entries, use the z-score halfway between the corresponding z-scores. Click to view page 1 of the standard normal table. Click to view page 2 of the standard normal table. |(Type an integer or decimal rounded to three decimal places as needed.) Enter your answer in the answer box. DELL XXarrow_forwardsolve for image and find critical valuesarrow_forwardDraw the standard normal curve that corresponds to an area between z = 0 and z = 2. Then, use the standard normal table to find the area under the curve between these two z-scores.arrow_forward
- Please solve for p value ,determine weather to reject hypothesis and state the conclusion for enough evidencearrow_forwardFind the z-score (to 2 decimal places) such that 8% of the normal curve lies to the right of the z-zone. Also draw a normal curve on your paper and illustrate the z score you found and the region represented.arrow_forwardDetermine the two z-scores that divide the area under the standard normal curve into a middle 0.23 area and two outside 0.385 areasarrow_forward
- Question :)arrow_forwardThe following table shows the hours studied and corresponding test grade earned by students on a recent test. Calculate the correlation coefficient, r, and determine whether r is statistically significant at the 0.01 level of significance. Round your answer to the nearest thousandth. Critical Values of the Pearson Correlation Coefficient Hours Studied and Test Grades Hours Studied 0 0.5 2 2.25 3.25 3.5 3.75 3.75 4 5 1 1 81 Test Grade 72 64 68 79 85 82 72 99 87 84 97arrow_forwardWhat percentage of the area under the normal curve is between the following z-scores? Z1= -2.39 Z2= 1.03arrow_forward
arrow_back_ios
arrow_forward_ios
Recommended textbooks for you
 MATLAB: An Introduction with ApplicationsStatisticsISBN:9781119256830Author:Amos GilatPublisher:John Wiley & Sons Inc
 Probability and Statistics for Engineering and th...StatisticsISBN:9781305251809Author:Jay L. DevorePublisher:Cengage Learning
 Statistics for The Behavioral Sciences (MindTap C...StatisticsISBN:9781305504912Author:Frederick J Gravetter, Larry B. WallnauPublisher:Cengage Learning
 Elementary Statistics: Picturing the World (7th E...StatisticsISBN:9780134683416Author:Ron Larson, Betsy FarberPublisher:PEARSON
 The Basic Practice of StatisticsStatisticsISBN:9781319042578Author:David S. Moore, William I. Notz, Michael A. FlignerPublisher:W. H. Freeman
 Introduction to the Practice of StatisticsStatisticsISBN:9781319013387Author:David S. Moore, George P. McCabe, Bruce A. CraigPublisher:W. H. Freeman

MATLAB: An Introduction with Applications
Statistics
ISBN:9781119256830
Author:Amos Gilat
Publisher:John Wiley & Sons Inc

Probability and Statistics for Engineering and th...
Statistics
ISBN:9781305251809
Author:Jay L. Devore
Publisher:Cengage Learning

Statistics for The Behavioral Sciences (MindTap C...
Statistics
ISBN:9781305504912
Author:Frederick J Gravetter, Larry B. Wallnau
Publisher:Cengage Learning

Elementary Statistics: Picturing the World (7th E...
Statistics
ISBN:9780134683416
Author:Ron Larson, Betsy Farber
Publisher:PEARSON

The Basic Practice of Statistics
Statistics
ISBN:9781319042578
Author:David S. Moore, William I. Notz, Michael A. Fligner
Publisher:W. H. Freeman

Introduction to the Practice of Statistics
Statistics
ISBN:9781319013387
Author:David S. Moore, George P. McCabe, Bruce A. Craig
Publisher:W. H. Freeman