
MATLAB: An Introduction with Applications
6th Edition
ISBN: 9781119256830
Author: Amos Gilat
Publisher: John Wiley & Sons Inc
expand_more
expand_more
format_list_bulleted
Related questions
Question
Explain to me the following two tables in detail and what is the difference between them
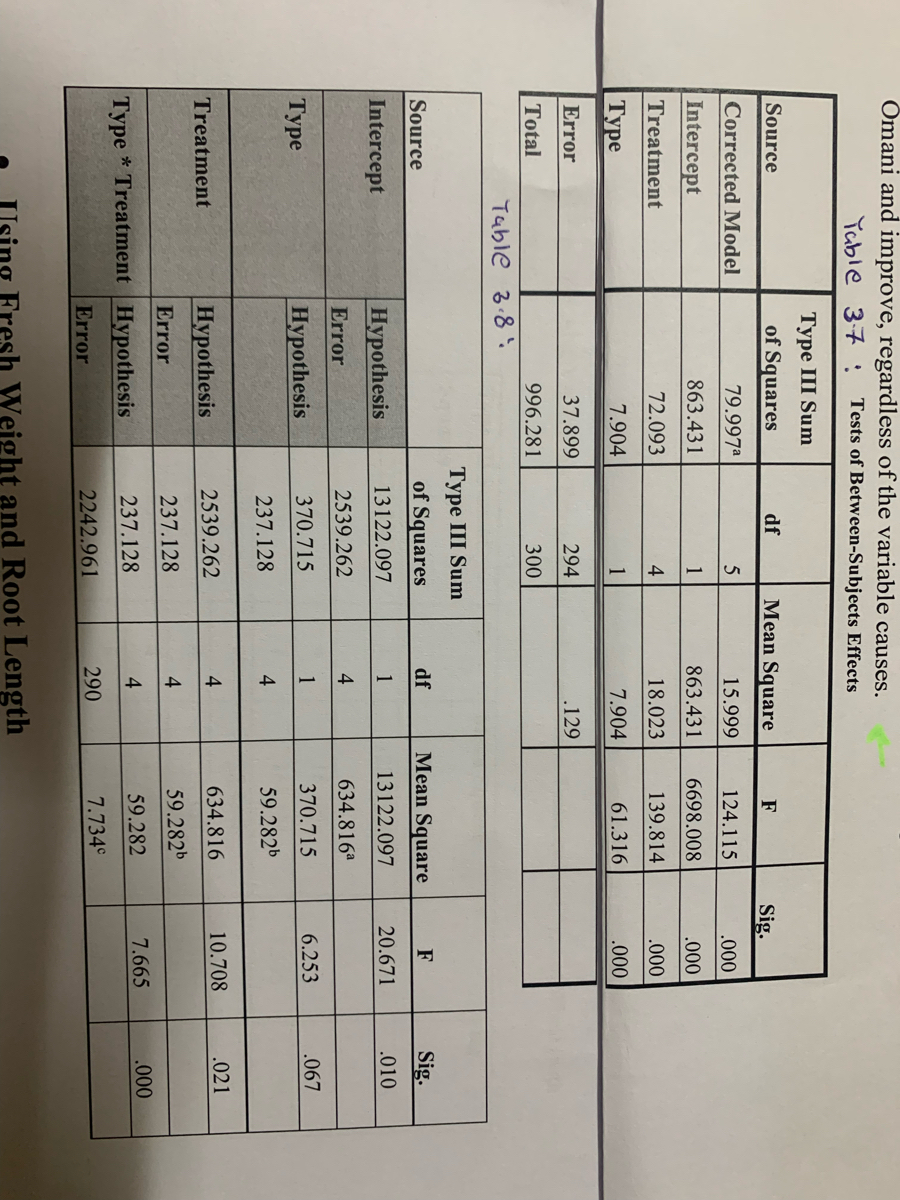

Transcribed Image Text:Omani and improve, regardless of the variable causes.
Table 37 :
Tests of Between-Subjects Effects
Source
Corrected Model
Intercept
Treatment
| Туре
Error
Total
Source
Intercept
Type
Type III Sum
of Squares
Table 3.8"
Treatment
79.997ª
863.431
72.093
7.904
37.899
996.281
Hypothesis
Error
Hypothesis
Hypothesis
Error
Type* Treatment Hypothesis
Error
df
5
1
4
1
294
300
Mean Square
15.999
863.431
18.023
7.904
.129
Type III Sum
of Squares
13122.097
2539.262
370.715
237.128
2539.262
237.128
237.128
2242.961
df
1
4
1
4
4
4
4
290
sing Fresh Weight and Root Length
F
124.115
6698.008
139.814
61.316
Mean Square
13122.097
634.816a
370.715
59.282b
634.816
59.282b
59.282
7.734°
Sig.
.000
.000
.000
.000
F
20.671
6.253
10.708
7.665
Sig.
.010
.067
.021
.000
Expert Solution
arrow_forward
Step 1
Given information:
The output for regression model is given.

Step by stepSolved in 2 steps

Knowledge Booster

Similar questions
- Below is data for two variables, X and Y. Answer the questions that follow. X Y X-MX Y-MY (X-MX)2 (Y-MY)2 (X-MX)(Y-MY) 3 3 -2 -1 4 1 2 4 3 -1 -1 1 1 ___ 6 4 1 ___ 1 0 0 7 6 2 2 ___ 4 4 What is the missing value under the (X-MX)(Y-MY) column? (far right column)arrow_forwardPlease answer the questions using the data in Table 8. (Note: You must use either Microsoft Excel or Minitab for this problem and include the table they produce with your work.) Questions 8A to 8C Table 8. Data for problem 8. I2 18.7 18.7 I1 9.2 9.3 9.6 9.0 11.7 8.2 11.0 10.0 10.5 8.7 18.1 21.3 21.1 19.7 19.7 19.5 16.4 19.7 13 27.4 23.8 38.1 32.4 24.6 27.0 25.0 27.5 26.3 43.1 80.6 62.8 137.3 94.8 62.0 72.6 68.2 79.5 86.9 154.1 8A. Use technology to find the multiple regression equation for the data shown in Table 8. (Note: You must use either Microsoft Excel or Minitab for this problem and include the table the app produces with your work to get full score.) 8B. Find the standard error of estimate and interpret the result. 8C. Find the coefficient of determination and interpret the result. (Note: do not use the adjusted R-square.)arrow_forwardThe head of the production would like to know how many work hours that the first 55% of the grand pianos need for completion. Use the data from problem 1 to answer this question for her. Please use excel or explain excel input to get answerarrow_forward
- Questions 7-10arrow_forwardProblem 6 (a) and (b) Hi, please help me solve the problem and all of its subquestions. Thank you!arrow_forwardThe next three questions are based on the following information: We're trying to determine if Lamborghini Aventador and Ferrari Enzo are different from each other based on their speed. In order to test this we record the average speed of 50 laps for each car. Which of the following is our alternate hypothesis O A. H1: Population average speed (Lamborghini) - Population average speed (Ferrari) = 0 B. H1: Population average speed (Lamborghini) - Population average speed (Ferrari) not equal to 0 C. H1: Population average speed (Lamborghini) - Population average speed (Ferrari) > 0 D. H1: Population average speed (Lamborghini) - Population average speed (Ferrari) < 0arrow_forward
arrow_back_ios
arrow_forward_ios
Recommended textbooks for you
- MATLAB: An Introduction with ApplicationsStatisticsISBN:9781119256830Author:Amos GilatPublisher:John Wiley & Sons Inc
 Probability and Statistics for Engineering and th...StatisticsISBN:9781305251809Author:Jay L. DevorePublisher:Cengage Learning
 Statistics for The Behavioral Sciences (MindTap C...StatisticsISBN:9781305504912Author:Frederick J Gravetter, Larry B. WallnauPublisher:Cengage Learning
  Elementary Statistics: Picturing the World (7th E...StatisticsISBN:9780134683416Author:Ron Larson, Betsy FarberPublisher:PEARSON
 The Basic Practice of StatisticsStatisticsISBN:9781319042578Author:David S. Moore, William I. Notz, Michael A. FlignerPublisher:W. H. Freeman
 Introduction to the Practice of StatisticsStatisticsISBN:9781319013387Author:David S. Moore, George P. McCabe, Bruce A. CraigPublisher:W. H. Freeman
MATLAB: An Introduction with Applications
Statistics
ISBN:9781119256830
Author:Amos Gilat
Publisher:John Wiley & Sons Inc
Probability and Statistics for Engineering and th...
Statistics
ISBN:9781305251809
Author:Jay L. Devore
Publisher:Cengage Learning
Statistics for The Behavioral Sciences (MindTap C...
Statistics
ISBN:9781305504912
Author:Frederick J Gravetter, Larry B. Wallnau
Publisher:Cengage Learning
Elementary Statistics: Picturing the World (7th E...
Statistics
ISBN:9780134683416
Author:Ron Larson, Betsy Farber
Publisher:PEARSON
The Basic Practice of Statistics
Statistics
ISBN:9781319042578
Author:David S. Moore, William I. Notz, Michael A. Fligner
Publisher:W. H. Freeman
Introduction to the Practice of Statistics
Statistics
ISBN:9781319013387
Author:David S. Moore, George P. McCabe, Bruce A. Craig
Publisher:W. H. Freeman