
MATLAB: An Introduction with Applications
6th Edition
ISBN: 9781119256830
Author: Amos Gilat
Publisher: John Wiley & Sons Inc
expand_more
expand_more
format_list_bulleted
Related questions
Concept explainers
Topic Video
Question
Questions c and d please.
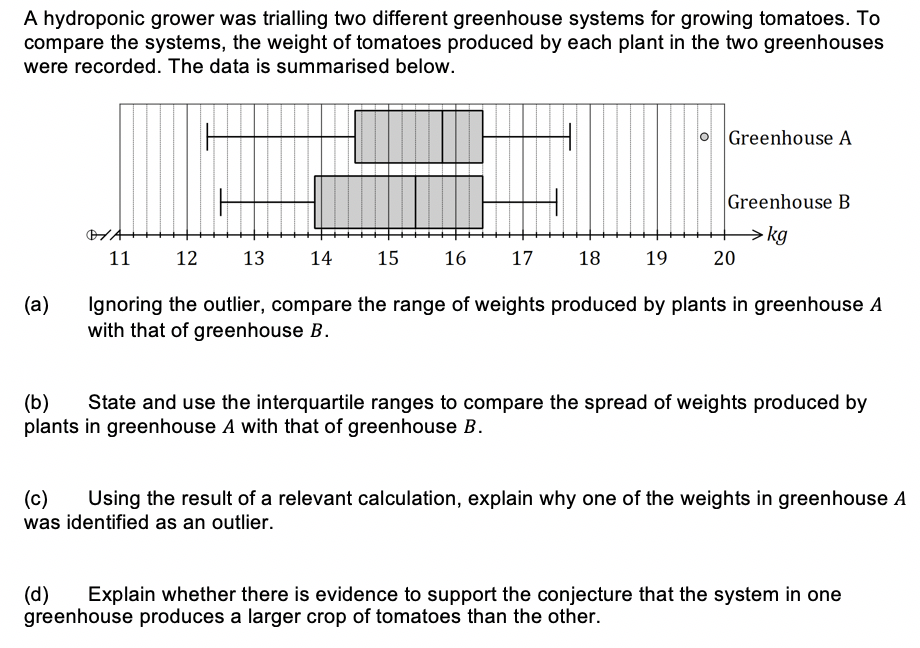

Transcribed Image Text:A hydroponic grower was trialling two different greenhouse systems for growing tomatoes. To
compare the systems, the weight of tomatoes produced by each plant in the two greenhouses
were recorded. The data is summarised below.
O Greenhouse A
Greenhouse B
kg
11
12
13
14
15
16
17
18
19
20
(а)
Ignoring the outlier, compare the range of weights produced by plants in greenhouse A
with that of greenhouse B.
(b)
plants in greenhouse A with that of greenhouse B.
State and use the interquartile ranges to compare the spread of weights produced by
(c)
was identified as an outlier.
Using the result of a relevant calculation, explain why one of the weights in greenhouse A
(d)
greenhouse produces a larger crop of tomatoes than the other.
Explain whether there is evidence to support the conjecture that the system in one
Expert Solution
arrow_forward
Step 1
(c). Explain why one of the weights in green house A was identified as an outlier:
The presence of outliers is detected with the use lower and upper limits of the data set.
From the given boxplot, the values of quartiles are identified as given below:
First quartile is Q1 = 14.5 and third quartile is Q3 = 16.4
The inter quartile range is obtained below as:
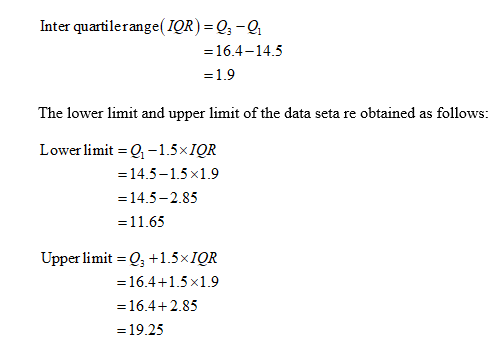
Outliers are the values that are less than the lower limit of the data set and the values that are greater than the upper limit of the data set.
The value of 19.7 is greater than the upper limit 19.25.
Hence, the data point 19.7 is an outlier.

Step by stepSolved in 2 steps with 1 images

Knowledge Booster


Learn more about
Need a deep-dive on the concept behind this application? Look no further. Learn more about this topic, statistics and related others by exploring similar questions and additional content below.Similar questions
- Karla picks up her friend who lives in another city and they head north on a road trip. Karla looks at a map and sees that after 5 hours of driving, they are passing mileage marker 352 on Highway 277. After driving for 12 hours, they pass mileage marker 842. What is Karla's average rate during the road trip? miles per hourarrow_forwardIn a school there are 20 teachers who teach mathematics or physics. Of these, 12 teach mathematics and 4 teach both physics and mathematics. How many teach physics ?arrow_forwardOne third of the cars available for sale in a dealership are used cars. If there are 20 new cars, how many cars are there in the dealership?arrow_forward
- A real estate agent has $1,152 to spend on ads each ad cost $16 how much ads will the real estate agent be able to buy.arrow_forwardJake is a train conductor. Every day he rides 20 miles to Jonesboro, 17.5 miles to Carver City, and 76.3 miles to Clinton. He then travels the same route back home. How many miles does he travel each day?arrow_forward
arrow_back_ios
arrow_forward_ios
Recommended textbooks for you
- MATLAB: An Introduction with ApplicationsStatisticsISBN:9781119256830Author:Amos GilatPublisher:John Wiley & Sons Inc
 Probability and Statistics for Engineering and th...StatisticsISBN:9781305251809Author:Jay L. DevorePublisher:Cengage Learning
 Statistics for The Behavioral Sciences (MindTap C...StatisticsISBN:9781305504912Author:Frederick J Gravetter, Larry B. WallnauPublisher:Cengage Learning
  Elementary Statistics: Picturing the World (7th E...StatisticsISBN:9780134683416Author:Ron Larson, Betsy FarberPublisher:PEARSON
 The Basic Practice of StatisticsStatisticsISBN:9781319042578Author:David S. Moore, William I. Notz, Michael A. FlignerPublisher:W. H. Freeman
 Introduction to the Practice of StatisticsStatisticsISBN:9781319013387Author:David S. Moore, George P. McCabe, Bruce A. CraigPublisher:W. H. Freeman
MATLAB: An Introduction with Applications
Statistics
ISBN:9781119256830
Author:Amos Gilat
Publisher:John Wiley & Sons Inc
Probability and Statistics for Engineering and th...
Statistics
ISBN:9781305251809
Author:Jay L. Devore
Publisher:Cengage Learning
Statistics for The Behavioral Sciences (MindTap C...
Statistics
ISBN:9781305504912
Author:Frederick J Gravetter, Larry B. Wallnau
Publisher:Cengage Learning
Elementary Statistics: Picturing the World (7th E...
Statistics
ISBN:9780134683416
Author:Ron Larson, Betsy Farber
Publisher:PEARSON
The Basic Practice of Statistics
Statistics
ISBN:9781319042578
Author:David S. Moore, William I. Notz, Michael A. Fligner
Publisher:W. H. Freeman
Introduction to the Practice of Statistics
Statistics
ISBN:9781319013387
Author:David S. Moore, George P. McCabe, Bruce A. Craig
Publisher:W. H. Freeman