
MATLAB: An Introduction with Applications
6th Edition
ISBN: 9781119256830
Author: Amos Gilat
Publisher: John Wiley & Sons Inc
expand_more
expand_more
format_list_bulleted
Related questions
Concept explainers
Question
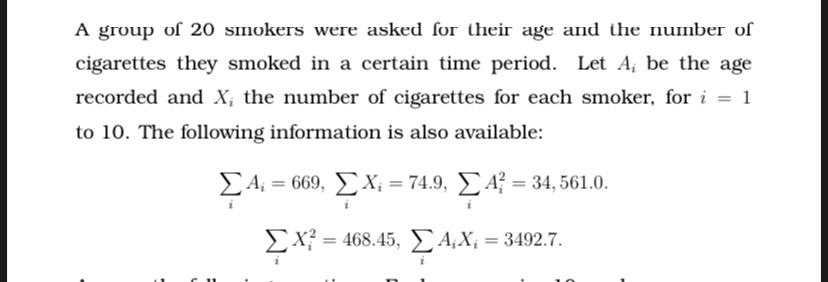

Transcribed Image Text:A group of 20 smokers were asked for their age and the number of
cigarettes they smoked in a certain time period. Let A, be the age
recorded and X; the number of cigarettes for each smoker, for i = 1
to 10. The following information is also available:
£4, =
- 669 , Σ X -74.9 , ΣΑ34,561.0.
Ex? = 468.45, EA;X; = 3492.7.

Transcribed Image Text:1. Explain the phrase 'Correlation is not Causation.' Give possible ex-
planations for both a negative correlation and then for a positive
correlation between the variables A and X discussed here.
loto the
Expert Solution
This question has been solved!
Explore an expertly crafted, step-by-step solution for a thorough understanding of key concepts.

This is a popular solution

Trending nowThis is a popular solution!

Step by stepSolved in 4 steps with 2 images

Knowledge Booster


Learn more about
Need a deep-dive on the concept behind this application? Look no further. Learn more about this topic, statistics and related others by exploring similar questions and additional content below.Similar questions
- You calculate a correlation coefficient of -0.8 for the two characteristics of eating a particular fruit and having a particular level of blood cholesterol. What can you conclude? There is not enough information in this question to provide an answer. The more of this fruit you eat, the lower your blood cholesterol will be. There is no correlation between eating this fruit and having a particular level of blood cholesterol. The more of this fruit you eat, the higher your blood cholesterol will be. There is a correlation between eating this fruit and having a particular blood cholesterol, but the value of 0.8 is too low to draw any conclusions.arrow_forwardIf r = +0.2 for 'Age' versus 'Hours spent on social media', what is your conclusion? There is a weak/no covariance between the two variables There is a moderate covariance between the two variables There is a moderate correlation between the two variables There is a weak/no correlation between the two variablesarrow_forwardA hospital found that a lower outside temperature indicates a higher number of patient visits. What can we determine from this information? There is no correlation between outside temperature and number of patient visits. There is a correlation between outside temperature and number of patient visits. However, there is no causation. This is because there is an increase in the number of patient visits with a decrease in the temperature outside. There is a correlation between outside temperature and number of patient visits. There may or may not be causation. Further studies would have to be done to determine this.arrow_forward
- A correlation coefficient provides two pieces of information about a relationship between two variables. These are -Strength; direction of relationship - Direction, proportions - Direction, which one causes which - Which one causes which, effect size. READ FIRST: Show as much of your work in the text box below as possible, and include the rest in your scratch work. Scratch work supports what you write on this exam form. At the minimum, type your answers to each of the following 5 questions A-E in the text box - do not refer me to your scratch work for the answers. Do show your work (on the exam form or scratch work) for the calculations needed to answer B, so partial credit can be given in the case of a math error that throws off your calculations. The best way to do this is inside tables if possible. Total 10 15 You conduct a survey to find out whether talking on a cell phone during a romantic date bothers people. You want to find out if there is a gender difference on this issue,…arrow_forwardA zero correlation bewteen X and Y is least likely to occur if?arrow_forwardCan you help me out by showing me an example of a weak positive correlation scatter plot? with a relistic example that shows the two variables that demonstrate this pattern?arrow_forward
- (5) The following data shows the gas prices from randomly selected gas stations from a certain city. Assume that the gas prices (in S) are normally distributed. 2.25 2.30 2.25 2.50 2.39 2.28 2.25 2.42 2.46 2.39 2.45 2.3 2.66 2.43 i) State the population parameter state above. ii) iii) Construct 97% confidence interval for the average gas price of this city, and interpret the confidence interval. Compute the margin of error?arrow_forwardAn r value of .8 indicates a strong positive correlation. True Falsearrow_forwardHello I need help with this one, calculate the Pearson product-moment correlations between at least two sets of variables in the Happiness and Engagement Dataset. Perform one correlation between two dependent variables. Perform the second correlation on an independent variable and the dependent variable OR between a different set of two dependent variables Calculate the Pearson product-moment correlations between the two sets of variables in your data set. Describe the correlations and their strength and direction.arrow_forward
- True or False: If the correlation coefficient from two variables X and Y , the number of shark attacks and number of iced lemonade sales, respectively, is r= 0.98, we can conclude that an increase in iced lemonade sales causes an increase in shark attacks.arrow_forwardWhat does a correlation coefficient of 2 indicate? There is a weak relationship between the two quantitative variables. It indicates a calculation error, as the correlation coefficient cannot be 2. There is a strong relationship between the two quantitative variables. It indicates a non-linear relationship between the two quantitative variables. There is no linear relationship between the two quantitative variables.arrow_forwardA survey was taken in 2018 that asked people about their saving habits. Researchers wanted to know if people who saved more also spent less. The scatterplot below shows their results when comparing two variables: the amount people reported that they put into savings each month, and the amount they reported that they spent on clothes. The researchers found the correlation coefficient for this data to be -0.239. Which of the following is true about these variables? a. There is no relationship between savings and money spent on clothes each month.b. There is a weak, positive linear relationship between savings and money spent on clothes each month.c. There is a perfect, negative linear relationship between savings and money spent on clothes each month.d. There is a weak, negative linear relationship between savings and money spent on clothes each month.arrow_forward
arrow_back_ios
SEE MORE QUESTIONS
arrow_forward_ios
Recommended textbooks for you
- MATLAB: An Introduction with ApplicationsStatisticsISBN:9781119256830Author:Amos GilatPublisher:John Wiley & Sons Inc
 Probability and Statistics for Engineering and th...StatisticsISBN:9781305251809Author:Jay L. DevorePublisher:Cengage Learning
 Statistics for The Behavioral Sciences (MindTap C...StatisticsISBN:9781305504912Author:Frederick J Gravetter, Larry B. WallnauPublisher:Cengage Learning
  Elementary Statistics: Picturing the World (7th E...StatisticsISBN:9780134683416Author:Ron Larson, Betsy FarberPublisher:PEARSON
 The Basic Practice of StatisticsStatisticsISBN:9781319042578Author:David S. Moore, William I. Notz, Michael A. FlignerPublisher:W. H. Freeman
 Introduction to the Practice of StatisticsStatisticsISBN:9781319013387Author:David S. Moore, George P. McCabe, Bruce A. CraigPublisher:W. H. Freeman
MATLAB: An Introduction with Applications
Statistics
ISBN:9781119256830
Author:Amos Gilat
Publisher:John Wiley & Sons Inc
Probability and Statistics for Engineering and th...
Statistics
ISBN:9781305251809
Author:Jay L. Devore
Publisher:Cengage Learning
Statistics for The Behavioral Sciences (MindTap C...
Statistics
ISBN:9781305504912
Author:Frederick J Gravetter, Larry B. Wallnau
Publisher:Cengage Learning
Elementary Statistics: Picturing the World (7th E...
Statistics
ISBN:9780134683416
Author:Ron Larson, Betsy Farber
Publisher:PEARSON
The Basic Practice of Statistics
Statistics
ISBN:9781319042578
Author:David S. Moore, William I. Notz, Michael A. Fligner
Publisher:W. H. Freeman
Introduction to the Practice of Statistics
Statistics
ISBN:9781319013387
Author:David S. Moore, George P. McCabe, Bruce A. Craig
Publisher:W. H. Freeman