MATLAB: An Introduction with Applications
6th Edition
ISBN: 9781119256830
Author: Amos Gilat
Publisher: John Wiley & Sons Inc
expand_more
expand_more
format_list_bulleted
Question

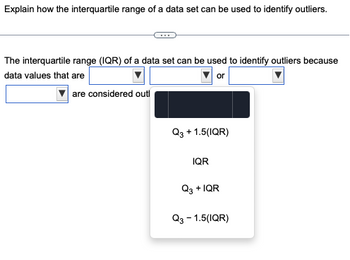
Transcribed Image Text:Explain how the interquartile range of a data set can be used to identify outliers.
The interquartile range (IQR) of a data set can be used to identify outliers because
data values that are
or
are considered outl
Q3 + 1.5(IQR)
IQR
Q3 + IQR
Q3 - 1.5(IQR)
Expert Solution
This question has been solved!
Explore an expertly crafted, step-by-step solution for a thorough understanding of key concepts.
Step by stepSolved in 3 steps with 4 images

Knowledge Booster
Similar questions
- B) Identify any possible outliers. C) Determine if the point is influential. To change in slope or intercept is significant if it is larger than 10%."The point (is/is not) an influential point because the slopes with the point included and without the point included (are/are not) significantly different, and the intercepts (are/are not) significantly different."arrow_forwardFind the 5 number summary for the data shown 10 17 40 41 46 52 53 59 65 98 5 number summary: IQR: }¯ The 1.5 x IQR rule states that values between and are likely not outliers.arrow_forward26. How can you describe the spread of data using a box-and-whisker plot?arrow_forward
- Pls help ASAParrow_forwardDetermine whether the following statement is true or false. If it is false, rewrite it as a true statement. The mean is the measure of central tendency most likely to be affected by an outlier. Choose the correct answer below. OA. The statement is false. Outliers do not affect any measure of central tendency. B. The statement is false. The mode is the measure of central tendency most likely to be affected by an outlier. OC. The statement is false. The median is the measure of central tendency most likely to be affected by an outlier. OD. The statement is true.arrow_forwardDiscuss any outliers in the data . What criteria did you use to identify outliers?arrow_forward
- Use the IQR to determine if any of the data in the data set are outliers. {23,80,43,23,0,20,23,23,20,28}{23,80,43,23,0,20,23,23,20,28} Any data value less than Answer or greater than Answer are outliers.arrow_forwardWhat does the "box" of a box-and-whisker plot encompass? Outliers None of these Minimum and maximum Q1, Q2, Q3arrow_forwardDetermine the direction, form, strength, and any outliers on the scatter plot. This scatter plot has a negative association, form is linear, strength is weak, and there are no apparent outliers. This scatter plot has a negative association, form is nonlinear, strength is weak, and there is one possible outlier. This scatter plot has a positive association, form is linear, strength is weak, and there is one possible outlier. This scatter plot has a positive association, form is linear, strength is strong, and there are no apparent outliers.arrow_forward
- The five number summary of a dataset was found to be: 46, 52, 59, 62, 67 An observation is considered an outlier if it is below: An observation is considered an outlier if it is abovearrow_forwardUnder each boxplot, write a comment about the presence or absence of any outliers (for example, there are __number of outliers or there are no outliers in the ________data)arrow_forwardAn outlierarrow_forward
arrow_back_ios
SEE MORE QUESTIONS
arrow_forward_ios
Recommended textbooks for you
 MATLAB: An Introduction with ApplicationsStatisticsISBN:9781119256830Author:Amos GilatPublisher:John Wiley & Sons Inc
 Probability and Statistics for Engineering and th...StatisticsISBN:9781305251809Author:Jay L. DevorePublisher:Cengage Learning
 Statistics for The Behavioral Sciences (MindTap C...StatisticsISBN:9781305504912Author:Frederick J Gravetter, Larry B. WallnauPublisher:Cengage Learning
 Elementary Statistics: Picturing the World (7th E...StatisticsISBN:9780134683416Author:Ron Larson, Betsy FarberPublisher:PEARSON
 The Basic Practice of StatisticsStatisticsISBN:9781319042578Author:David S. Moore, William I. Notz, Michael A. FlignerPublisher:W. H. Freeman
 Introduction to the Practice of StatisticsStatisticsISBN:9781319013387Author:David S. Moore, George P. McCabe, Bruce A. CraigPublisher:W. H. Freeman

MATLAB: An Introduction with Applications
Statistics
ISBN:9781119256830
Author:Amos Gilat
Publisher:John Wiley & Sons Inc

Probability and Statistics for Engineering and th...
Statistics
ISBN:9781305251809
Author:Jay L. Devore
Publisher:Cengage Learning

Statistics for The Behavioral Sciences (MindTap C...
Statistics
ISBN:9781305504912
Author:Frederick J Gravetter, Larry B. Wallnau
Publisher:Cengage Learning

Elementary Statistics: Picturing the World (7th E...
Statistics
ISBN:9780134683416
Author:Ron Larson, Betsy Farber
Publisher:PEARSON

The Basic Practice of Statistics
Statistics
ISBN:9781319042578
Author:David S. Moore, William I. Notz, Michael A. Fligner
Publisher:W. H. Freeman

Introduction to the Practice of Statistics
Statistics
ISBN:9781319013387
Author:David S. Moore, George P. McCabe, Bruce A. Craig
Publisher:W. H. Freeman