
ENGR.ECONOMIC ANALYSIS
14th Edition
ISBN: 9780190931919
Author: NEWNAN
Publisher: Oxford University Press
expand_more
expand_more
format_list_bulleted
Related questions
Question
Solve all this question......you will not solve all questions then I will give you down?? upvote....
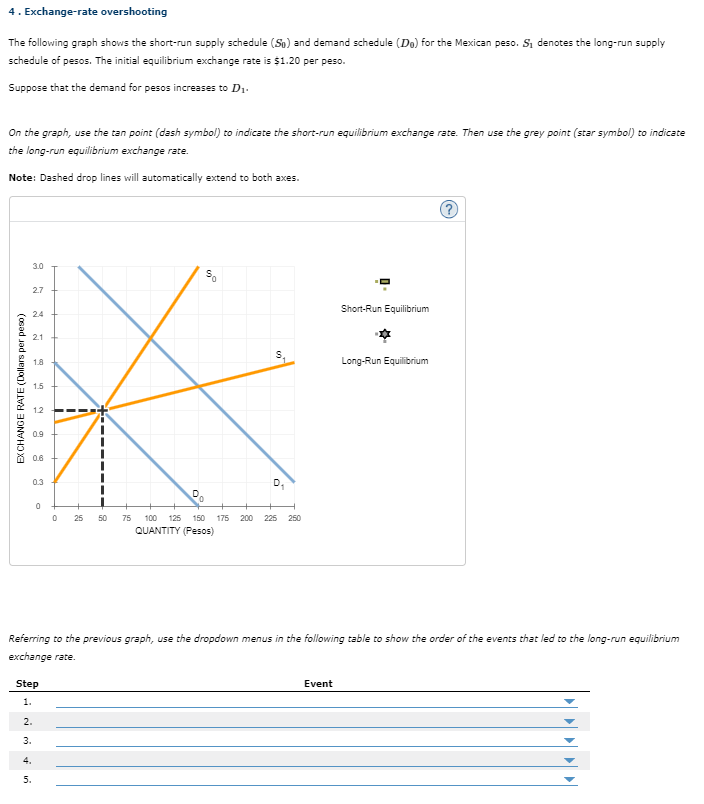

Transcribed Image Text:4. Exchange-rate overshooting
The following graph shows the short-run supply schedule (So) and demand schedule (Do) for the Mexican peso. S₁ denotes the long-run supply
schedule of pesos. The initial equilibrium exchange rate is $1.20 per peso.
Suppose that the demand for pesos increases to D₁.
On the graph, use the tan point (dash symbol) to indicate the short-run equilibrium exchange rate. Then use the grey point (star symbol) to indicate
the long-run equilibrium exchange rate.
Note: Dashed drop lines will automatically extend to both axes.
EXCHANGE RATE (Dollars per peso)
3.0
2.7
24
2.1
1.8
0.9
0.6
0.3
0
0 25 50
Step
1.
2.
3.
0°
$0
S₂
75 100 125 150 175 200 225 250
QUANTITY (Pesos)
Short-Run Equilibrium
Referring to the previous graph, use the dropdown menus in the following table to show the order of the events that led to the long-run equilibrium
exchange rate.
Event
Long-Run Equilibrium

Transcribed Image Text:Referring
exchange
Step
1.
2.
3.
5.
The Mexican price of U.S. exports decreases, and the quantity of U.S. exports demanded increases.
The quantity of pesos supplied increases.
The dollar depreciates to $2.10 per peso.
The supply schedule of pesos becomes more elastic, as shown by S₁.
The dollar appreciates to $1.50 per peso.
that led to the long
Expert Solution
This question has been solved!
Explore an expertly crafted, step-by-step solution for a thorough understanding of key concepts.

This is a popular solution

Trending nowThis is a popular solution!

Step by stepSolved in 4 steps with 1 images

Knowledge Booster


Learn more about
Need a deep-dive on the concept behind this application? Look no further. Learn more about this topic, economics and related others by exploring similar questions and additional content below.Similar questions
- Please correct answer and don't use hand ratingarrow_forwardGive typing answer with explanation and conclusion Consider a good or service where consumers pay more than its actual valuation (for eg, products with markup prices at retail significantly higher than their cost: greetings cards, bottled water, stock price, movie theatre popcorn/candy). Based on the irrational decision-making and marginal analysis, explain why such irrational decision-making could take place in this situation.arrow_forwardOscar purchased a $30 steak for dinner, but burned it bad on the grill. Since he paid top dollar for the steak he figures he should eat it anyways. Is Oscar properly using economic reasoning? Yes, the marginal cost of not eating the steak would be $30. No, the $30 spent on the steak is a sunk cost and should not be included in his decision whether to eat the steak or not.. Yes, if he doesn't eat the steak he will have wasted economic resources. No, the opportunity of eating the steak is whatever else he could have purchased for the $30.arrow_forward
- Solve all this question......you will not solve all questions then I will give you down?? upvote....arrow_forwardSolve all this question......you will not solve all questions then I will give you down?? upvote.....arrow_forwardThe questions are attached in the image. The questions are based on 'General equilibrium' model in 'economics'. (please do not tag it in some other subject) These are simple Multiple choice questions which are undergrad level. Please do not reject them. The answers to 45,46 and 47 are D,C and C respectively. Please answer the following as well: 1. For 45, provide the set of pareto efficient outcomes. 2. For 46, provide an algebric solution if possible. Provide a mathematical argument. 3. For 47, provide provide a set of points (if exists) that will take us to the given equilibrium under the given conditions. The questions are easy. PLEASE DO NOT REJECT IT!arrow_forward
arrow_back_ios
arrow_forward_ios
Recommended textbooks for you
 Principles of Economics (12th Edition)EconomicsISBN:9780134078779Author:Karl E. Case, Ray C. Fair, Sharon E. OsterPublisher:PEARSON
 Engineering Economy (17th Edition)EconomicsISBN:9780134870069Author:William G. Sullivan, Elin M. Wicks, C. Patrick KoellingPublisher:PEARSON
 Principles of Economics (MindTap Course List)EconomicsISBN:9781305585126Author:N. Gregory MankiwPublisher:Cengage Learning
 Managerial Economics: A Problem Solving ApproachEconomicsISBN:9781337106665Author:Luke M. Froeb, Brian T. McCann, Michael R. Ward, Mike ShorPublisher:Cengage Learning
 Managerial Economics & Business Strategy (Mcgraw-...EconomicsISBN:9781259290619Author:Michael Baye, Jeff PrincePublisher:McGraw-Hill Education
Principles of Economics (12th Edition)
Economics
ISBN:9780134078779
Author:Karl E. Case, Ray C. Fair, Sharon E. Oster
Publisher:PEARSON
Engineering Economy (17th Edition)
Economics
ISBN:9780134870069
Author:William G. Sullivan, Elin M. Wicks, C. Patrick Koelling
Publisher:PEARSON
Principles of Economics (MindTap Course List)
Economics
ISBN:9781305585126
Author:N. Gregory Mankiw
Publisher:Cengage Learning
Managerial Economics: A Problem Solving Approach
Economics
ISBN:9781337106665
Author:Luke M. Froeb, Brian T. McCann, Michael R. Ward, Mike Shor
Publisher:Cengage Learning
Managerial Economics & Business Strategy (Mcgraw-...
Economics
ISBN:9781259290619
Author:Michael Baye, Jeff Prince
Publisher:McGraw-Hill Education