A First Course in Probability (10th Edition)
10th Edition
ISBN: 9780134753119
Author: Sheldon Ross
Publisher: PEARSON
expand_more
expand_more
format_list_bulleted
Question

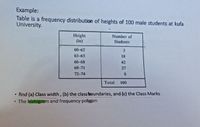
Transcribed Image Text:Example:
Table is a frequency distribution of heights of 100 male students at kufa
University.
Height
(in)
Number of
Students
60-62
63-65
18
66-68
42
69-71
27
72-74
8
Total
100
find (a) Class width, (b) the class boundaries, and (c) the Class Marks
The histogram and frequency polygon
Expert Solution
This question has been solved!
Explore an expertly crafted, step-by-step solution for a thorough understanding of key concepts.
This is a popular solution
Trending nowThis is a popular solution!
Step by stepSolved in 2 steps with 2 images

Knowledge Booster
Learn more about
Need a deep-dive on the concept behind this application? Look no further. Learn more about this topic, probability and related others by exploring similar questions and additional content below.Similar questions
- Help with frequency tablearrow_forwardUse the frequency histogram to complete the following parts. Employee Salaries 300- (a) Determine the number of classes. (b) Estimate the greatest and least frequencies. (c) Determine the class width. (d) Describe any patterns with the data. 200- 100- 34.5 44.5 54.5 64.5 74.5 84.5 94.5 Salary (in thousands of dollars) (a) There are 7 classes. Rouanbasarrow_forwardUse the frequency histogram to complete the following parts. (a) Determine the number of classes. (b) Estimate the greatest and least frequencies. (c) Determine the class width. (d) Describe any patterns with the data. Frequency Employee Salaries 300- 200- 100- ☑ 0 32 37 42 47 52 57 62 Salary (in thousands of dollars) (a) There are classes. (Type a whole number.) (b) The least frequency is about (Round to the nearest whole number as needed.) The greatest frequency is about (Round to the nearest whole number as needed.) (c) The class width is (Type an integer or a decimal. Do not round.) (d) What pattern does the histogram show? A. About half of the employees' salaries are between $50,000 and $59,000. B. About half of the employees' salaries are between $40,000 and $49,000. C. Less than half of the employees make between $35,000 and $59,000. D. Most employees make less than $34,000 or more than $60,000.arrow_forward
- b) Make a frequency polygon of the test scores.Apparent Limits frequency93-95 190-92 287-89 684-86 881-83 978-80 775-77 672-74 369-71 466-68 263-65 060-62 2arrow_forward11arrow_forwardThe following table gives the frequency distribution of the commute distances (in miles) for the population of 50 instructors at a local community college. Commute Distance (miles) Frequency 11 - 15 9 16 - 20 14 21 - 25 12 26 - 30 8 31 - 35 5 36 - 40 2 What is the Class Width for this frequency distribution? Class Width = [cw] miles = ______________arrow_forward
- 1.0 0,9 0.8 8,7 8,6 Cunulative Relative Frequency- 0,5 8.4 8,3 0.2 0,1 10 15 20 Values Based on the graph above, what is the relative frequency of the 15-to-20 class?arrow_forwardThe data in the table represent the tuition for all 2-year community colleges in a region in 2014-2015. (a) Complete the cumulative frequency distribution. (a) Construct a cumulative frequency distribution. (b) Construct a cumulative relative frequency distribution. (c) Draw a frequency polygon. (d) Draw a relative frequency ogive. Tuition Cumulative (dollars) Frequency 775-799 800-824 Tuition Number of (dollars) Community Colleges 825-849 775-799 20 850-874 800-824 65 875-899 825-849 14 850-874 900-924 875-899 925-949 900-924 950-974 925-949 950-974 1 (b) Complete the cumulative relative frequency distribution. Tuition Cumulative Relative (dollars) Frequency 775-799 800-824 825-849 850-874 875-899 900-924 925-949 950-974 (Round to three decimal places as needed.)arrow_forwardSuppose a survey of adults and teens (ages 12-17) in a certain country was conducted to determine the number of texts sent in a single day. (a) Construct a relative frequency distribution for adults. (b) Construct a relative frequency distribution for teens. (c) Construct a side-by-side relative frequency bar graph. (d) Compare the texting habits of adults and teens. Number of Texts Adults Teens None 164 8. 1-10 977 137 11-20 253 62 21-50 258 118 51-100 125 107 100 + 156 181 ... (c) Choose the correct graph below. Adults Teens 0.6 Adults Teens 0.67 0.4- O A. 0.2- 0.4 B. 0.2- None 1-10 11-20 21-50 51-100 100+ None 1-10 11-20 21-50 51-100 100+ Adults Teens 0.6J Adults| Teens 0.6J 0.4- 0.2- 0.4- O D. 0.2- 0- None 1-10 11-20 21-50 51-100 100+ None 1-10 11-20 21-50 51-100 100+ (d) Choose the correct answer below. A. Teens are more likely to send few or many texts per day, while adults are more likely to send a moderate number of texts per day. B. Adults are more likely to send few or many…arrow_forward
arrow_back_ios
SEE MORE QUESTIONS
arrow_forward_ios
Recommended textbooks for you
 A First Course in Probability (10th Edition)ProbabilityISBN:9780134753119Author:Sheldon RossPublisher:PEARSON

A First Course in Probability (10th Edition)
Probability
ISBN:9780134753119
Author:Sheldon Ross
Publisher:PEARSON
