
MATLAB: An Introduction with Applications
6th Edition
ISBN: 9781119256830
Author: Amos Gilat
Publisher: John Wiley & Sons Inc
expand_more
expand_more
format_list_bulleted
Related questions
Question
thumb_up100%
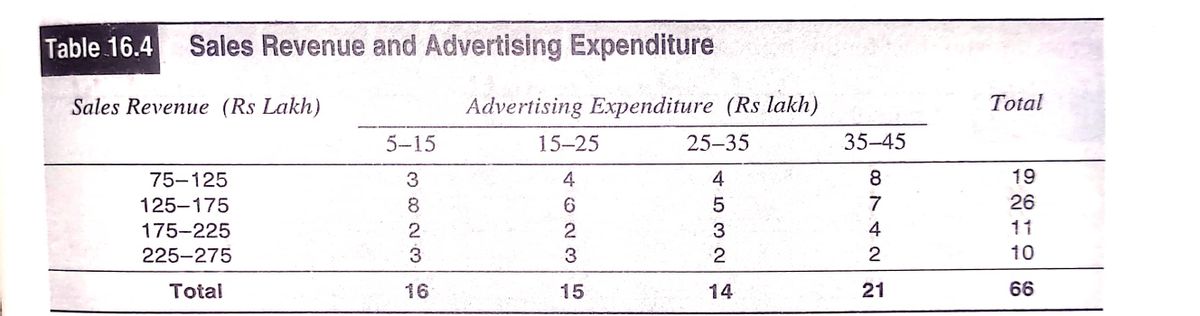

Transcribed Image Text:Table 16.4
Sales Revenue and Advertising Expenditure
Sales Revenue (Rs Lakh)
Advertising Expenditure (Rs lakh)
Total
5-15
15-25
25-35
35-45
75-125
3
4
8.
19
125-175
8.
6.
7
26
175-225
4
11
225-275
3
2
10
Total
16
15
14
21
66
4 53

Transcribed Image Text:Example 16.4) The data given in Table 16.4 are used to calculate the correlation coefficient. Tahle 16 .
shows the worksheet for this purpose. This is followed by the calculation of correlation coefficient
Table 16.5 Computation of Correlation Coefficient
5–15
15-25
25-35
35-45
Total
MV
10
20
30
40
MV
dx →
-1
1
2
fdy
fdy²
fáxdy
dy I
75–125
100
-1
3(3)
8(0)
2(-2)
3(-6)
4(0)
6(0)
2(0)
3(0)
4(-4)
8(-16)
7(0)
4(8)
2(8)
19
-19
19
-17
125-175
150
5(0)
26
175-225
200
1
3(3)
2(4)
11
11
11
9.
225-275
250
2
10
20
40
6.
Total
f
16
15
14
21
66
12
70
-2
fdx
-16
14
42
40
fdx?
16
14
84
114
fdxdy
-5
Check
3
-2
Expert Solution
This question has been solved!
Explore an expertly crafted, step-by-step solution for a thorough understanding of key concepts.

This is a popular solution

Trending nowThis is a popular solution!

Step by stepSolved in 2 steps with 2 images

Knowledge Booster

Similar questions
- H234567 8 9 10 11 12 13 14 15 16 17 18 19 20 21 22 23 24 25 26 27 28 29 30 31 32 33 34 35 36 37 38 39 40 41 42 Tests A 1 2,431 4,098 17 18 13 4,141 4,283 5,292 73 150 4,510 4,284 1,394 2,202 2,053 1,539 3,332 4,291 1,770 4,557 1,420 66 3,818 2,154 558 1,645 2,738 4,598 2,465 4,831 2,686 556 4,363 1,775 1,295 801 5,691 4,993 4,338 2.259 Cases B 50 0 705 772 1 ONE WP 3 3 1,127 870 768 11 31 1,251 1,140 460 280 328 306 505 1,149 452 924 484 5 1,035 614 169 252 757 940 670 710 523 125 1,285 527 120 154 885 587 964 616 C D E F G H I J - K Larrow_forwardPlease answer question 7-8 all part and show workarrow_forwardHow will do simple correlation using data shown in R? Thanks.arrow_forward
- Chapter 4 Homework Score: 3/14 3/14 answered Question 1 Based on the data shown below, calculate the correlation coefficient (to three decimal places) y 4 27.54 26.8 27.96 29.02 31.68 9. 34.24 Question Help: MMessage instructor Submit Question 5678arrow_forward2. For this question use the following set of data points. Use Excel's CORREL function to find the value of the correlation coefficient. 1 1 2 2 3 3 3 10 1 2 3 1 3 1 2 3 10 (a) Obtain a scatter plot of the 10 data points. (b) Find the value of the correlation coefficient for the 10 data points. (c) Use Excel with a = 0.05 to determine if there is a linear correlation. Now remove the point with coordinates (10, 10) so there are 9 pairs of points. (d) Obtain a scatter plot of the 9 data points. (e) Find the value of the correlation coefficient for the 9 data points. (f) Use Excel with a = 0.05 to determine if there is a linear correlation. (g) What conclusion do you make about the possible effect of a single pair of values?arrow_forwardConsider the following table of data. 2 3 4 y 1 1 1 1.1 (a) Calculate the correlation coefficient. (b) Sketch a graph of the data. (c) Based on how closely the data fits a straight line, is your answer to part (a) surprising? Discuss the extent to which the correlation coefficient describes how well the data fit a horizontal line.arrow_forward
- I need answer typing clear urjent no chatgpt i will give upvote 10 upvotesarrow_forwardAfter gathering data about the number of starfish and measuring the pollution in areas of the ocean you find a negative linear correlation between pollution levels and number of starfish. What can you conclude based on this information? a. There is a confounding variable that is affecting both pollution and starfish. b. As pollution rises the number of starfish falls c. That pollution is causing starfish to die, leading to the negative correlation d. That pollution is supporting starfish, leading to the negative correlationarrow_forward#1arrow_forward
arrow_back_ios
arrow_forward_ios
Recommended textbooks for you
- MATLAB: An Introduction with ApplicationsStatisticsISBN:9781119256830Author:Amos GilatPublisher:John Wiley & Sons Inc
 Probability and Statistics for Engineering and th...StatisticsISBN:9781305251809Author:Jay L. DevorePublisher:Cengage Learning
 Statistics for The Behavioral Sciences (MindTap C...StatisticsISBN:9781305504912Author:Frederick J Gravetter, Larry B. WallnauPublisher:Cengage Learning
  Elementary Statistics: Picturing the World (7th E...StatisticsISBN:9780134683416Author:Ron Larson, Betsy FarberPublisher:PEARSON
 The Basic Practice of StatisticsStatisticsISBN:9781319042578Author:David S. Moore, William I. Notz, Michael A. FlignerPublisher:W. H. Freeman
 Introduction to the Practice of StatisticsStatisticsISBN:9781319013387Author:David S. Moore, George P. McCabe, Bruce A. CraigPublisher:W. H. Freeman
MATLAB: An Introduction with Applications
Statistics
ISBN:9781119256830
Author:Amos Gilat
Publisher:John Wiley & Sons Inc
Probability and Statistics for Engineering and th...
Statistics
ISBN:9781305251809
Author:Jay L. Devore
Publisher:Cengage Learning
Statistics for The Behavioral Sciences (MindTap C...
Statistics
ISBN:9781305504912
Author:Frederick J Gravetter, Larry B. Wallnau
Publisher:Cengage Learning
Elementary Statistics: Picturing the World (7th E...
Statistics
ISBN:9780134683416
Author:Ron Larson, Betsy Farber
Publisher:PEARSON
The Basic Practice of Statistics
Statistics
ISBN:9781319042578
Author:David S. Moore, William I. Notz, Michael A. Fligner
Publisher:W. H. Freeman
Introduction to the Practice of Statistics
Statistics
ISBN:9781319013387
Author:David S. Moore, George P. McCabe, Bruce A. Craig
Publisher:W. H. Freeman