
MATLAB: An Introduction with Applications
6th Edition
ISBN: 9781119256830
Author: Amos Gilat
Publisher: John Wiley & Sons Inc
expand_more
expand_more
format_list_bulleted
Related questions
Question

Transcribed Image Text:1530 Module 5
HW
<
Question 10, 4.1.39-T
>
Part 1 of 8
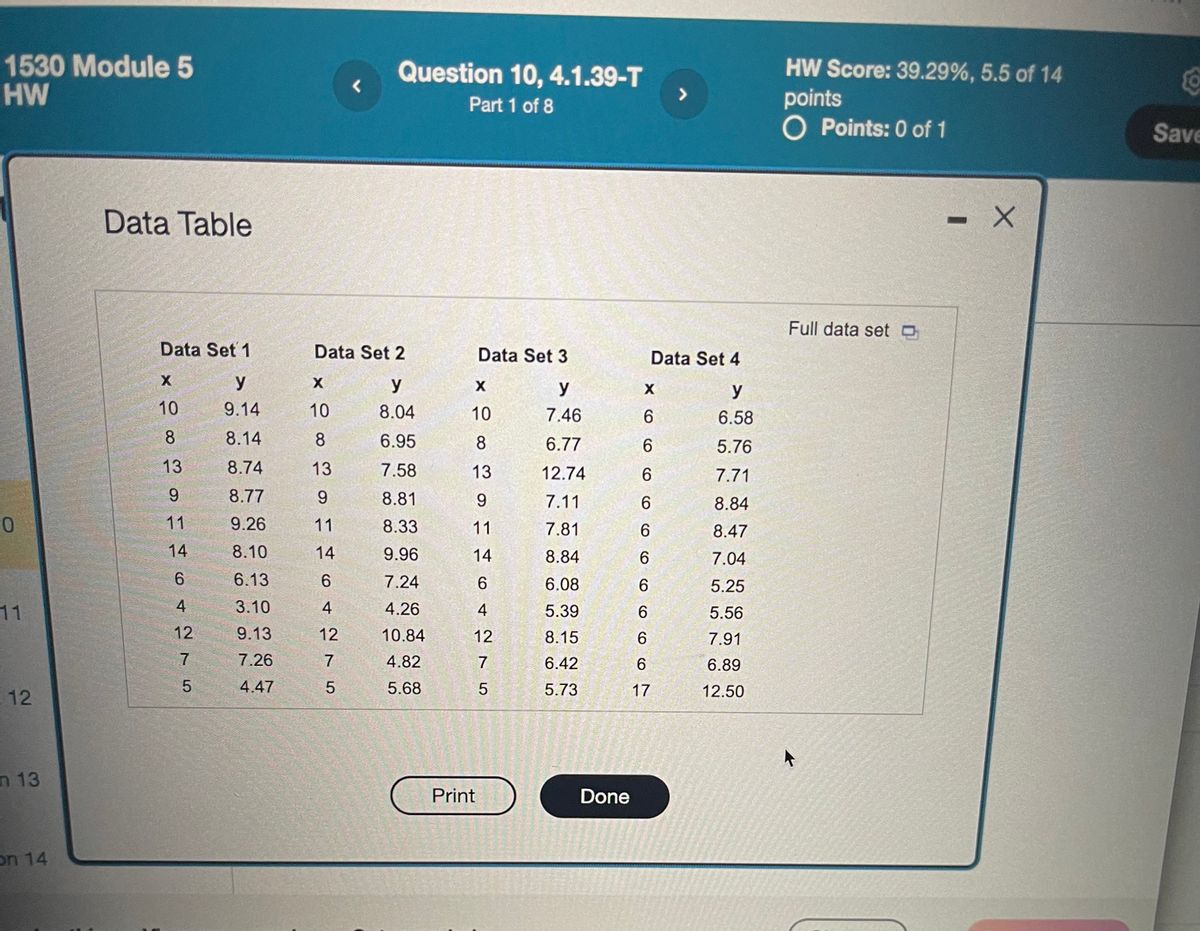
Data Table
HW Score: 39.29%, 5.5 of 14
points
O Points: 0 of 1
Full data set C
Data Set 1
Data Set 2
Data Set 3
Data Set 4
X
y
X
y
X
y
10
9.14
10
8.04
10
7.46
91
X
y
6
6.58
8
8.14
8
6.95
8
6.77
6
5.76
13
8.74
13
7.58
13
12.74
6
7.71
9
8.77
9
8.81
9
7.11
6
8.84
0
11
9.26
11
8.33
11
7.81
6
8.47
14
8.10
14
9.96
14
8.84
6
7.04
6
6.13
6
7.24
4
3.10
11
12
9.13
7
7.26
5
4.47
4275
4.26
12
10.84
4.82
5.68
64275
6.08
6
5.25
5.39
6
5.56
12
8.15
6
7.91
6.42
6
6.89
5.73
17
12.50
12
n 13
on 14
Print
Done
- X
Save

Transcribed Image Text:O Module 5
A
K
Question 10, 4.1.39-T
r
7
Part 1 of 8
HW Score: 39.29%, 5.5 of 14
points
O Points: 0 of 1
Consider the four data sets shown in the accompanying table. Complete parts (a) and (b) below.
Click the icon to view the data table.
(a) Compute the linear correlation coefficient for each data set.
The linear correlation coefficient for the first data set is ☐ .
(Round to three decimal places as needed.)
lve this
View an example
Get more help -
Clear all
Check answer
Save
n
In
Expert Solution
This question has been solved!
Explore an expertly crafted, step-by-step solution for a thorough understanding of key concepts.

This is a popular solution

Trending nowThis is a popular solution!

Step by stepSolved in 2 steps with 8 images

Knowledge Booster

Similar questions
arrow_back_ios
arrow_forward_ios
Recommended textbooks for you
- MATLAB: An Introduction with ApplicationsStatisticsISBN:9781119256830Author:Amos GilatPublisher:John Wiley & Sons Inc
 Probability and Statistics for Engineering and th...StatisticsISBN:9781305251809Author:Jay L. DevorePublisher:Cengage Learning
 Statistics for The Behavioral Sciences (MindTap C...StatisticsISBN:9781305504912Author:Frederick J Gravetter, Larry B. WallnauPublisher:Cengage Learning
  Elementary Statistics: Picturing the World (7th E...StatisticsISBN:9780134683416Author:Ron Larson, Betsy FarberPublisher:PEARSON
 The Basic Practice of StatisticsStatisticsISBN:9781319042578Author:David S. Moore, William I. Notz, Michael A. FlignerPublisher:W. H. Freeman
 Introduction to the Practice of StatisticsStatisticsISBN:9781319013387Author:David S. Moore, George P. McCabe, Bruce A. CraigPublisher:W. H. Freeman
MATLAB: An Introduction with Applications
Statistics
ISBN:9781119256830
Author:Amos Gilat
Publisher:John Wiley & Sons Inc
Probability and Statistics for Engineering and th...
Statistics
ISBN:9781305251809
Author:Jay L. Devore
Publisher:Cengage Learning
Statistics for The Behavioral Sciences (MindTap C...
Statistics
ISBN:9781305504912
Author:Frederick J Gravetter, Larry B. Wallnau
Publisher:Cengage Learning
Elementary Statistics: Picturing the World (7th E...
Statistics
ISBN:9780134683416
Author:Ron Larson, Betsy Farber
Publisher:PEARSON
The Basic Practice of Statistics
Statistics
ISBN:9781319042578
Author:David S. Moore, William I. Notz, Michael A. Fligner
Publisher:W. H. Freeman
Introduction to the Practice of Statistics
Statistics
ISBN:9781319013387
Author:David S. Moore, George P. McCabe, Bruce A. Craig
Publisher:W. H. Freeman