MATLAB: An Introduction with Applications
6th Edition
ISBN: 9781119256830
Author: Amos Gilat
Publisher: John Wiley & Sons Inc
expand_more
expand_more
format_list_bulleted
Concept explainers
Topic Video
Question

Transcribed Image Text:V
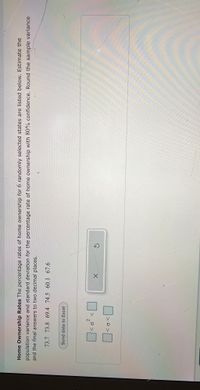
Home Ownership Rates The percentage rates of home ownership for 6 randomly selected states are listed below. Estimate the
population variance and standard deviation for the percentage rate of home ownership with 80% confidence. Round the sample variance
and the final answers to two decimal places.
73.7 73.8 69.4 74.5 60.1 67.6
Send data to Excel
2.
>o>
Expert Solution
This question has been solved!
Explore an expertly crafted, step-by-step solution for a thorough understanding of key concepts.
Step by stepSolved in 2 steps

Knowledge Booster
Learn more about
Need a deep-dive on the concept behind this application? Look no further. Learn more about this topic, statistics and related others by exploring similar questions and additional content below.Similar questions
- A researcher wants to know if the news station a person watches is a factor in the amount of time (in minutes) that they watch. The table below shows data that was collected from a survey. Local FOX CNN 44 55 65 46 62 65 32 24 49 22 67 52 23 63 59 38 63 57 26 18 37 38 29 41 The test-statistic for this data = (Please show your answer to 3 decimal places.) The p-value for this sample = (Please show your answer to 4 decimal places.) The p-value is αα Base on this, we should hypothesis As such, the final conclusion is that... There is sufficient evidence to support the claim that station is a factor in the amount of time people watch the news. There is insufficient evidence to support the claim that station is a factor in the amount of time people watch the news.arrow_forwardThe ages (in years) of a random sample of shoppers at a gaming store are shown. Determine the range, mean, variance, and standard deviation of the sample data set. 12, 20, 23, 14, 18, 18, 19, 18, 15, 19 1) The range is ______ 2) The mean is ______ 3) The variance is ________arrow_forwardActuaries use various parameters when evaluating the cost of a life insurance policy. The variance of the life spans of a population is one of the parameters used for the evaluation. Each year, the actuaries at a particular insurance company randomly sample 30 people who died during the year (with the samples chosen independently from year to year) to see whether the variance of life spans has changed. The life span data from this year and from last year are summarized below. Current Last Year Year x1 = 75.8 | x,= 76.2 si= 47.61 s3= = 92.16 (The first row gives the sample means and the second row gives the sample variances.) Assume that life spans are approximately normally distributed for each of the populations of people who died this year and people who died last year. Can we conclude, at the 0.05 significance level, that the variance of the life span for the current year, of, differs from the variance of the life span for last year, o,? Perform a two-tailed test. Then complete the…arrow_forward
- For computing the variance this number is called as the value that is added or subtracted from the most probable value a. accuracy b. mistake c. error d. probable errorarrow_forwardThe owner of a farmer's market was interested in determining how many oranges a person buys when they buy oranges. He asked the cashiers over a weekend to count how many oranges a person bought when they bought oranges and record this number analysis at a later time. The data is given below in the table. The random variable x represents the number of oranges purchased and P(x) represents the probability that a customer will buy x oranges. Determine the variance of the number of oranges purchased by a customer. Round to two decimal places. X P(x) 1 0.05 O A. 0.56 OB. 3.97 OC. 3.57 OD. 1.95 2 3 0.19 0.20 4 5 0.25 0.12 6 0.10 7 8 0 0.08 9 10- 0 0.01arrow_forward
arrow_back_ios
arrow_forward_ios
Recommended textbooks for you
 MATLAB: An Introduction with ApplicationsStatisticsISBN:9781119256830Author:Amos GilatPublisher:John Wiley & Sons Inc
 Probability and Statistics for Engineering and th...StatisticsISBN:9781305251809Author:Jay L. DevorePublisher:Cengage Learning
 Statistics for The Behavioral Sciences (MindTap C...StatisticsISBN:9781305504912Author:Frederick J Gravetter, Larry B. WallnauPublisher:Cengage Learning
 Elementary Statistics: Picturing the World (7th E...StatisticsISBN:9780134683416Author:Ron Larson, Betsy FarberPublisher:PEARSON
 The Basic Practice of StatisticsStatisticsISBN:9781319042578Author:David S. Moore, William I. Notz, Michael A. FlignerPublisher:W. H. Freeman
 Introduction to the Practice of StatisticsStatisticsISBN:9781319013387Author:David S. Moore, George P. McCabe, Bruce A. CraigPublisher:W. H. Freeman

MATLAB: An Introduction with Applications
Statistics
ISBN:9781119256830
Author:Amos Gilat
Publisher:John Wiley & Sons Inc

Probability and Statistics for Engineering and th...
Statistics
ISBN:9781305251809
Author:Jay L. Devore
Publisher:Cengage Learning

Statistics for The Behavioral Sciences (MindTap C...
Statistics
ISBN:9781305504912
Author:Frederick J Gravetter, Larry B. Wallnau
Publisher:Cengage Learning

Elementary Statistics: Picturing the World (7th E...
Statistics
ISBN:9780134683416
Author:Ron Larson, Betsy Farber
Publisher:PEARSON

The Basic Practice of Statistics
Statistics
ISBN:9781319042578
Author:David S. Moore, William I. Notz, Michael A. Fligner
Publisher:W. H. Freeman

Introduction to the Practice of Statistics
Statistics
ISBN:9781319013387
Author:David S. Moore, George P. McCabe, Bruce A. Craig
Publisher:W. H. Freeman