
MATLAB: An Introduction with Applications
6th Edition
ISBN: 9781119256830
Author: Amos Gilat
Publisher: John Wiley & Sons Inc
expand_more
expand_more
format_list_bulleted
Related questions
Question
thumb_up100%
Estimate the average weekly TV hours watched by students at this university with 99% confidence.
What is the parameter of interest?
- Single Proportion,
- Single
Mean , - Difference in Proportions,
- Difference in Independent Means,
- Mean Difference (matched pairs),
What type(s) of variables?
- One Quantitative
- One Categorical
- One Quantitative and One Categorical
- Two Categorical
What conditions need to be checked?
what is the formula for the correct Confidence Interval or Test Statistic?
Define each variable in the formula and give its value.
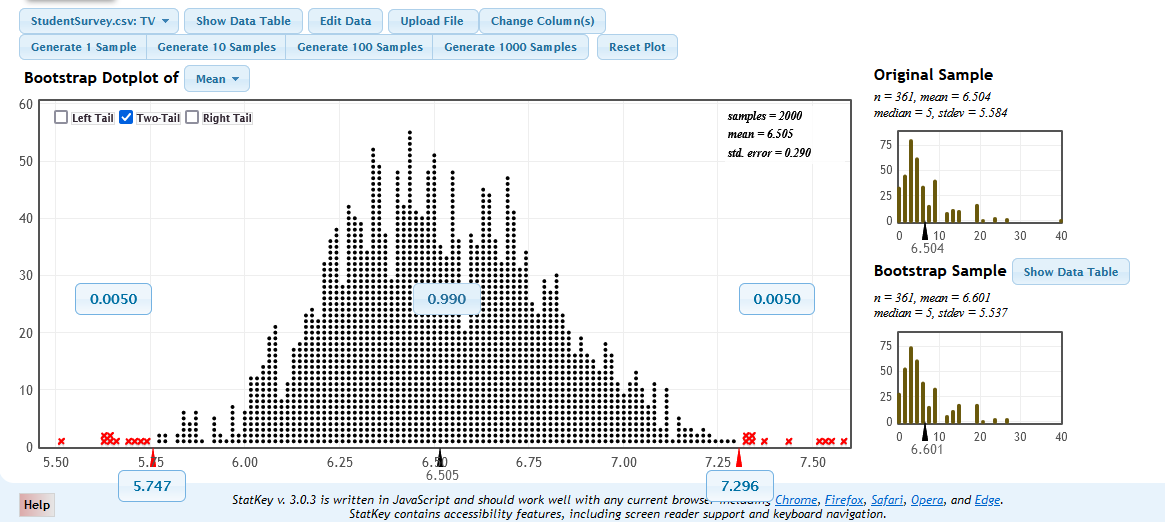

Transcribed Image Text:Show Data Table Edit Data
Upload File
Change Column(s)
StudentSurvey.csv: TV
Generate 1 Sample Generate 10 Samples Generate 100 Samples Generate 1000 Samples
Bootstrap Dotplot of Mean
60
50
40
30
20
10
0
X
5.50
Help
Left Tail ✔ Two-Tail Right Tail
0.0050
8x 2000 ::
5.15
5.747
6.00
6.25
0.990
6.50
6.505
6.75
Reset Plot
7.00
samples - 2000
mean = 6.505
std. error = 0.290
7.25
0.0050
**
X
xxxxx x
7.50
Original Sample
n = 361, mean = 6.504
median = 5, stdev = 5.584
75
50
25
0
75
50
Bootstrap Sample Show Data Table
n = 361, mean = 6.601
median = 5, stdev = 5.537
25
0
0
10
6.504
0
..…...…..
20 30 40
dll.
20
10
6.601
7.296
StatKey v. 3.0.3 is written in JavaScript and should work well with any current browsers Chrome, Firefox, Safari, Opera, and Edge.
StatKey contains accessibility features, including screen reader support and keyboard navigation.
30
40
Expert Solution
This question has been solved!
Explore an expertly crafted, step-by-step solution for a thorough understanding of key concepts.

This is a popular solution

Trending nowThis is a popular solution!

Step by stepSolved in 5 steps

Knowledge Booster

Similar questions
- A random sample of 100 m&m's produced 17 green m&m's. What is the point estimate for the population proportion of green m&m's? Construct the 95% confidence interval for the true proportion of green m&m'sarrow_forwardFind the test statistics, p-value and confidence interval using statcrunch or excel. thank youarrow_forwardDetermine the point estimate of the population mean and margin of error for the confidence interval. Lower bound is 17, upper bound is 27. Question content area bottom Part 1 The point estimate of the population mean is enter your response here.arrow_forward
- Identifying TestsFor the following prompts include:- the name of the test- the parameter being tested, H0 and Ha.Example: What test would you use to determine whether the starting salariesfor statisticians are greater than $80,000?Ans: One-sample t-test for population mean, H0 : µ = $80, 000 vs. Ha : µ >$80,000.a. The 2010 Census found that the average family size in Minnesota was 3.05.What statistical procedure would you use to test whether the average familysize in Minnesota is greater than 3.05 in 2019?b. According to the 2017 American Community Survey, 5.7% of all workers inMinneapolis/St. Paul urbanized area commute to work by public transportation. What statistical procedure would you use to test whether the proportionof workers in Minneapolis/St. Paul urbanized area commute to work by publictransportation in 2019 has changed from than in 2015?c. According to the 2017 American Community Survey, 4.3% of all workers inMinneapolis/St. Paul urbanized area work in construction.…arrow_forwardtrying to figure out 80% confidence interval?arrow_forwardUse the data on student load Student Unit Load 3, 12, 6, 9, 6, 12, 15, 12, 7, 9, 3 What is the point estimate for mean student unit load? Construct the 90% confidence interval for mean student load. Assume all requirements have been met.arrow_forward
- How do I construct a confidence interval of the requested level with the given data below: x=28, n=64, confidence level 93%arrow_forwardWe wish to estimate what percent of adult residents in Ventura County like chocolate. Out of 500 adult residents sampled, 302 like chocolate. To construct a 90% confidence interval for the proportion (p) of adult residents who like chocolate in Ventura County, you need to use which one of the following calculator? O Hypothesis Test for a Population Mean Given Statistics O Hypothesis Test for a Population Proportion O Two Dependent Sample Means Comparison Given Data O Chi-Square Test for Independence O Confidence Interval for a Population Mean Given Statistics O Confidence Interval for a Population Proportion O Two Independent Proportions Comparison OTwo Independent Sample Means Comparison Given Data O Confidence Interval for a Population Mean Given Data O Chi-Square Test for Goodness of Fit One-Way ANOVA O Two Independent Sample Means Comparison Given Statistics O Hypothesis Test for a Population Mean Given Data a. Enter your answer as an open-interval (i.e., parentheses) using…arrow_forwardWhat do confidence intervals & hypothesis tests try to do?arrow_forward
- I want to estimate the population mean number of times that adults eat breakfast in a week. I spoke with 12 coworkers, and the numbers were 7, 5, 5, 7, 2, 3, 7, 5, 1, 0, 7, 6. Calculate a 95% confidence interval for the population mean (round 3 decimal places).arrow_forwardhttps://1drv.ms/x/s!AtOrdm3usPcAgmQXM6WPhcSyT3inarrow_forward
arrow_back_ios
arrow_forward_ios
Recommended textbooks for you
- MATLAB: An Introduction with ApplicationsStatisticsISBN:9781119256830Author:Amos GilatPublisher:John Wiley & Sons Inc
 Probability and Statistics for Engineering and th...StatisticsISBN:9781305251809Author:Jay L. DevorePublisher:Cengage Learning
 Statistics for The Behavioral Sciences (MindTap C...StatisticsISBN:9781305504912Author:Frederick J Gravetter, Larry B. WallnauPublisher:Cengage Learning
  Elementary Statistics: Picturing the World (7th E...StatisticsISBN:9780134683416Author:Ron Larson, Betsy FarberPublisher:PEARSON
 The Basic Practice of StatisticsStatisticsISBN:9781319042578Author:David S. Moore, William I. Notz, Michael A. FlignerPublisher:W. H. Freeman
 Introduction to the Practice of StatisticsStatisticsISBN:9781319013387Author:David S. Moore, George P. McCabe, Bruce A. CraigPublisher:W. H. Freeman
MATLAB: An Introduction with Applications
Statistics
ISBN:9781119256830
Author:Amos Gilat
Publisher:John Wiley & Sons Inc
Probability and Statistics for Engineering and th...
Statistics
ISBN:9781305251809
Author:Jay L. Devore
Publisher:Cengage Learning
Statistics for The Behavioral Sciences (MindTap C...
Statistics
ISBN:9781305504912
Author:Frederick J Gravetter, Larry B. Wallnau
Publisher:Cengage Learning
Elementary Statistics: Picturing the World (7th E...
Statistics
ISBN:9780134683416
Author:Ron Larson, Betsy Farber
Publisher:PEARSON
The Basic Practice of Statistics
Statistics
ISBN:9781319042578
Author:David S. Moore, William I. Notz, Michael A. Fligner
Publisher:W. H. Freeman
Introduction to the Practice of Statistics
Statistics
ISBN:9781319013387
Author:David S. Moore, George P. McCabe, Bruce A. Craig
Publisher:W. H. Freeman