
Human Anatomy & Physiology (11th Edition)
11th Edition
ISBN: 9780134580999
Author: Elaine N. Marieb, Katja N. Hoehn
Publisher: PEARSON
expand_more
expand_more
format_list_bulleted
Related questions
Question
How do I make a pie chart with this data?

Transcribed Image Text:Picture. It can be etfective communicutioh tool rore
Class:
Name:
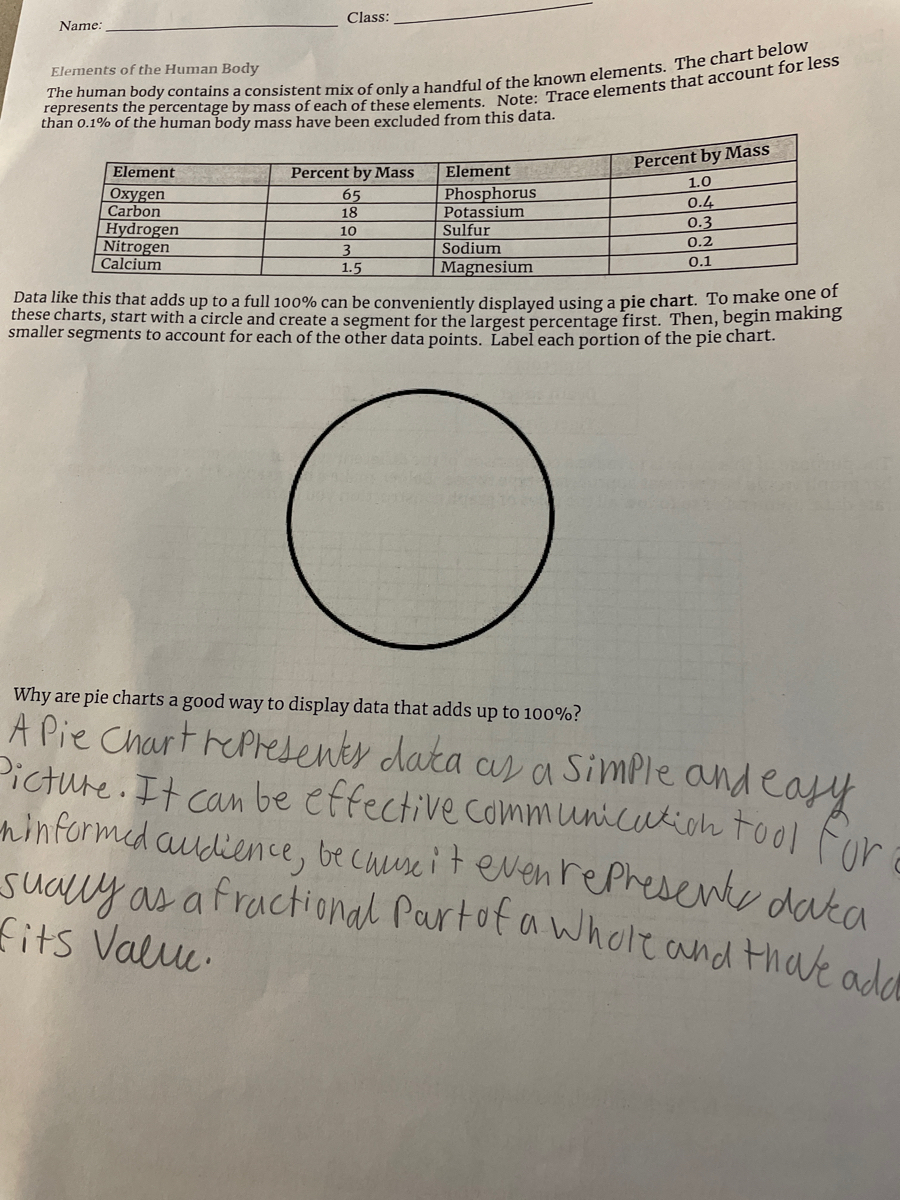
Elements of the Human Body
than 0.1% of the human body mass have been excluded from this data.
Element
Percent by Mass
Percent by Mass
Element
1.0
Oxygen
Carbon
Hydrogen
Nitrogen
Calcium
Phosphorus
Potassium
Sulfur
Sodium
Magnesium
65
0.4
0.3
18
10
0.2
3
0.1
1.5
Data like this that adds up to a full 100% can be conveniently displayed using a pie chart. To make one OL
these charts, start with a circle and create a segment for the largest percentage first. Then, begin making
smaller segments to account for each of the other data points. Label each portion of the pie chart.
Why are pie charts a good way to display data that adds up to 100%?
A Pie Chart rePredents data as a Simple and easyy
ninformed audience, be cuuse it evenrephesente daka
sualy as a fractional Partof.
fits Valu.
a whole and thak ad
Expert Solution
This question has been solved!
Explore an expertly crafted, step-by-step solution for a thorough understanding of key concepts.

This is a popular solution

Trending nowThis is a popular solution!

Step by stepSolved in 2 steps with 2 images

Knowledge Booster

Similar questions
- could you put this in dimensional analysisarrow_forwardThe experiment file says "Fill a cuvette with water and blank the spectrophotometer." What are we doing when we do this? Why is this step importantarrow_forwardOn the graph that relates absorbance to flavin concentration, draw a horizontal line that starts at the point on the y-axis that corresponds to the absorbance of your unknown sample and ends at the curve you drew through your data points . Next draw a vertical line that starts at the point where the horizontal line intersected the curve and ends at the x-axis. The point where this vertical line intersects the x-axis corresponds to the concentration of flavin in your unknown sample. What was the letter on the tube with your unknown sample? What is the concentration of the flavin in your unknownarrow_forward
- Do you think there will be a significant difference in the number of cfus/g enumerated from the surface of spinach between you and your classmates?arrow_forwardHow do you calculate dosages safely?arrow_forwardColoured and white beads were carefully selected for equality of size and shape. Equal quantities of each colour were then placed in a container. Randomly select enough beads to fill the cover of a petri dish. Count the number of beads of each colour and record your data in table 1.6. Then calculate the expected numbers based on the sample size and the known ratio of white to coloured beads. Complete the table and calculate 32. Table 1.6 Chi-Square Calculations for Colored And White Beads Phenotype O E (O-E) (O-E)2 (O-E)2/E Colored White Totals How many degrees of freedom are there? Using table 1.5, what 32 values lie on either side of your calculated 32 value? What are the probability values associated with the 32 values? Briefly interpret the 32 value you have just calculated.arrow_forward
arrow_back_ios
arrow_forward_ios
Recommended textbooks for you
- Human Anatomy & Physiology (11th Edition)BiologyISBN:9780134580999Author:Elaine N. Marieb, Katja N. HoehnPublisher:PEARSON
 Biology 2eBiologyISBN:9781947172517Author:Matthew Douglas, Jung Choi, Mary Ann ClarkPublisher:OpenStax
 Anatomy & PhysiologyBiologyISBN:9781259398629Author:McKinley, Michael P., O'loughlin, Valerie Dean, Bidle, Theresa StouterPublisher:Mcgraw Hill Education,
  Molecular Biology of the Cell (Sixth Edition)BiologyISBN:9780815344322Author:Bruce Alberts, Alexander D. Johnson, Julian Lewis, David Morgan, Martin Raff, Keith Roberts, Peter WalterPublisher:W. W. Norton & Company
 Laboratory Manual For Human Anatomy & PhysiologyBiologyISBN:9781260159363Author:Martin, Terry R., Prentice-craver, CynthiaPublisher:McGraw-Hill Publishing Co.
 Inquiry Into Life (16th Edition)BiologyISBN:9781260231700Author:Sylvia S. Mader, Michael WindelspechtPublisher:McGraw Hill Education
Human Anatomy & Physiology (11th Edition)
Biology
ISBN:9780134580999
Author:Elaine N. Marieb, Katja N. Hoehn
Publisher:PEARSON
Biology 2e
Biology
ISBN:9781947172517
Author:Matthew Douglas, Jung Choi, Mary Ann Clark
Publisher:OpenStax
Anatomy & Physiology
Biology
ISBN:9781259398629
Author:McKinley, Michael P., O'loughlin, Valerie Dean, Bidle, Theresa Stouter
Publisher:Mcgraw Hill Education,
Molecular Biology of the Cell (Sixth Edition)
Biology
ISBN:9780815344322
Author:Bruce Alberts, Alexander D. Johnson, Julian Lewis, David Morgan, Martin Raff, Keith Roberts, Peter Walter
Publisher:W. W. Norton & Company
Laboratory Manual For Human Anatomy & Physiology
Biology
ISBN:9781260159363
Author:Martin, Terry R., Prentice-craver, Cynthia
Publisher:McGraw-Hill Publishing Co.
Inquiry Into Life (16th Edition)
Biology
ISBN:9781260231700
Author:Sylvia S. Mader, Michael Windelspecht
Publisher:McGraw Hill Education