
MATLAB: An Introduction with Applications
6th Edition
ISBN: 9781119256830
Author: Amos Gilat
Publisher: John Wiley & Sons Inc
expand_more
expand_more
format_list_bulleted
Related questions
Concept explainers
Question
thumb_up100%
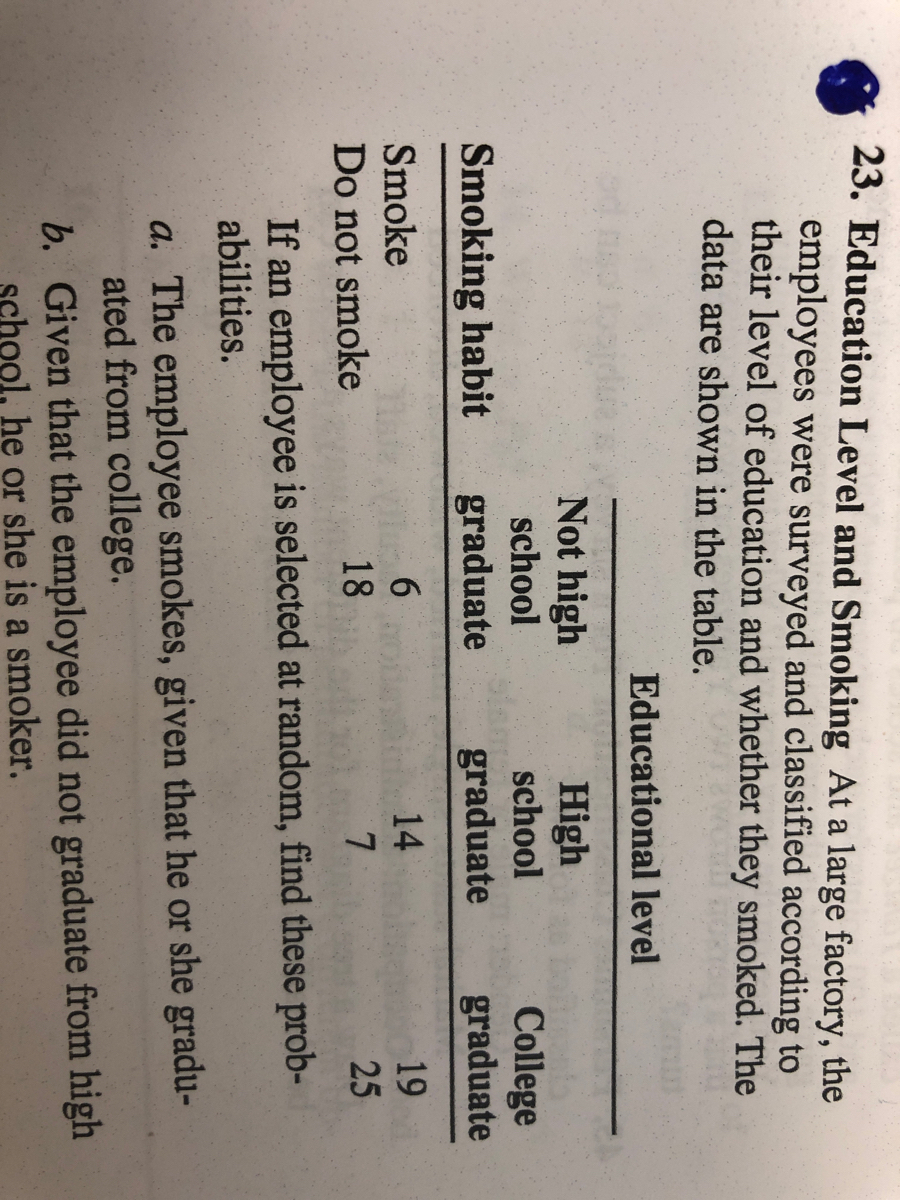

Transcribed Image Text:23. Education Level and Smoking At a large factory, the
employees were surveyed and classified according to
their level of education and whether they smoked. The
data are shown in the table.
Educational level
Not high
High
school
College
graduate
school
Smoking habit
graduate
graduate
19
25
Smoke
6.
14
Do not smoke
18
7.
If an employee is selected at random, find these prob-
abilities.
a. The employee smokes, given that he or she gradu-
ated from college.
b. Given that the employee did not graduate from high
school, he or she is a smoker.
Expert Solution
This question has been solved!
Explore an expertly crafted, step-by-step solution for a thorough understanding of key concepts.

Step by stepSolved in 3 steps with 2 images

Knowledge Booster


Learn more about
Need a deep-dive on the concept behind this application? Look no further. Learn more about this topic, statistics and related others by exploring similar questions and additional content below.Similar questions
- Hello, may I get an explanation for this SOON PLEASE? I am stuck! Questions are in the image provided.arrow_forwardOnly looking for a, b, and c.arrow_forwardA. Coin Let heads (H) = poetry Let tails (T) = science fiction or biography Toss coin three times. Repeat. B. Number cube Let even number = poetry Let off number = not poetry Roll the cube three times. Repeat. C. Random digits from 1 to 9 Let 1, 2, 3 = science fiction Let 4, 5, 6 = biography Let 7, 8, 9 = poetry Select three random digits from 1 to 9. Repeat. D. Coin Let heads (H) = science fiction Let tails (T) = biography or poetry Toss coin three times. Repeat.arrow_forward
- Please helparrow_forwardA random experiment consists of tossing a die and observing the number of dots showing up. Let A₁: number of dots showing up=3 A2: even number of dots showing up A3: odd number of dots showing up a. Are A2 and A3 disjoint? b. Are A and A3 independent?arrow_forwardResidence in the city are charge for water usage every three months the water bill is computed from a common fee along with the amount of water the customer uses the last water bill for 40 residence from two different neighborhoods are shown in the histogram below. which of the following is a true statement comparing the water bills of the two neighborhoods? more homes on front Street had water bills above 225 then on Pine Road more homes on Pine Road had water bills under 150 then on front Street more homes on Pine Road had water bill is above 200 then on front Street The same number of homes on both streets had water bills between 175 and 200arrow_forward
- Which of the following statements about the histogram are true? Select all that apply.arrow_forwardAdela Noriegam, a researcher wants to determine how employee salaries at a certain company are related to the length of employment, previous experience, and education. The researcher selects eight employees from the company and obtains the following data: Employee Salary,y Employment (in yrs), x1 Employment (in yrs), x2 Employment (in yrs), x3 A 57310 10 2 16 B 57380 5 6 16 C 54135 4 1 12 D 56985 6 5 14 E 58715 8 8 16 F 60000 20 0 12 G 59400 9 4 18 H 60720 15 7 17 What is the regression equation? Leave your answer in 2 decimal places Y = ()+() +() +arrow_forwardan you please answer drop down question, A, and B A. H0 = p1 or μ1 (=,<,>, ≠ ) p2 or μ2 H1= p1 or μ1 (=,<,>, ≠ ) p2 or μ2 B. Z or Tarrow_forward
- es metal parts. She measures each part to confirm ean the part is too small, and positive numbers the numbers the mechanic records in order from 3 1 1 1 4 32 8 32 16 ) 16 ) 3 1 1 1 5 162 16 4 8 32 32 3. 1 5 8 32 4 2 16 16 32 2 3 1 5 1 16 32 32) 8 162 Donearrow_forwardHi I am stuck, can I get help pleasearrow_forwardyansons lunch to go wants to know if there is a difference in customer satisfaction at any of the 3 locations. 500 customers were surveyed at each of the three locations, and the results of the survey is highlighted below dissatisfied one is 25 two is 10 and 3 is 40 satisfied one is 475 two is. 490 and three is 460. and totals are all 500. what is the correct degrees of freedom needed if you were to calculate X2 test statistic ?arrow_forward
arrow_back_ios
SEE MORE QUESTIONS
arrow_forward_ios
Recommended textbooks for you
- MATLAB: An Introduction with ApplicationsStatisticsISBN:9781119256830Author:Amos GilatPublisher:John Wiley & Sons Inc
 Probability and Statistics for Engineering and th...StatisticsISBN:9781305251809Author:Jay L. DevorePublisher:Cengage Learning
 Statistics for The Behavioral Sciences (MindTap C...StatisticsISBN:9781305504912Author:Frederick J Gravetter, Larry B. WallnauPublisher:Cengage Learning
  Elementary Statistics: Picturing the World (7th E...StatisticsISBN:9780134683416Author:Ron Larson, Betsy FarberPublisher:PEARSON
 The Basic Practice of StatisticsStatisticsISBN:9781319042578Author:David S. Moore, William I. Notz, Michael A. FlignerPublisher:W. H. Freeman
 Introduction to the Practice of StatisticsStatisticsISBN:9781319013387Author:David S. Moore, George P. McCabe, Bruce A. CraigPublisher:W. H. Freeman
MATLAB: An Introduction with Applications
Statistics
ISBN:9781119256830
Author:Amos Gilat
Publisher:John Wiley & Sons Inc
Probability and Statistics for Engineering and th...
Statistics
ISBN:9781305251809
Author:Jay L. Devore
Publisher:Cengage Learning
Statistics for The Behavioral Sciences (MindTap C...
Statistics
ISBN:9781305504912
Author:Frederick J Gravetter, Larry B. Wallnau
Publisher:Cengage Learning
Elementary Statistics: Picturing the World (7th E...
Statistics
ISBN:9780134683416
Author:Ron Larson, Betsy Farber
Publisher:PEARSON
The Basic Practice of Statistics
Statistics
ISBN:9781319042578
Author:David S. Moore, William I. Notz, Michael A. Fligner
Publisher:W. H. Freeman
Introduction to the Practice of Statistics
Statistics
ISBN:9781319013387
Author:David S. Moore, George P. McCabe, Bruce A. Craig
Publisher:W. H. Freeman