ENGR.ECONOMIC ANALYSIS
14th Edition
ISBN: 9780190931919
Author: NEWNAN
Publisher: Oxford University Press
expand_more
expand_more
format_list_bulleted
Question

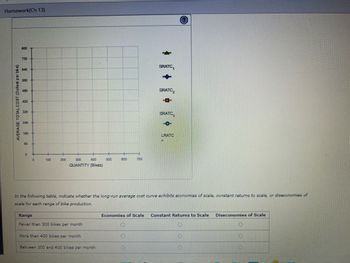
Transcribed Image Text:Homework(Ch 13)
AVERAGE TOTALCOST (Dollars per bike)
800
720
640
560
480
400
320
240
160
80
0
0
100
200
300
400
QUANTITY (Bikes)
Range
Fewer than 300 bikes per month
More than 400 bikes per month
500
Between 300 and 400 bikes per month
600
700
SRATC
In the following table, indicate whether the long-run average cost curve exhibits economies of scale, constant returns to scale, or diseconomies of
scale for each range of bike production.
0
O
SRATC₂
SRATC
O
LRATC
Economies of Scale Constant Returns to Scale
Diseconomies of Scale
O
O

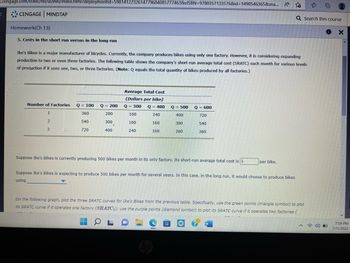
Transcribed Image Text:3.cengage.com/static/nb/ui/evo/index.html?deploymentid=5981412232614779684085777463&eISBN=9780357133576&id=1498546365&sna... A
<
CENGAGE MINDTAP
Homework(Ch 13)
5. Costs in the short run versus in the long run
Ike's Bikes is a major manufacturer of bicycles. Currently, the company produces bikes using only one factory. However, it is considering expanding
production to two or even three factories. The following table shows the company's short-run average total cost (SRATC) each month for various levels
of production if it uses one, two, or three factories. (Note: Q equals the total quantity of bikes produced by all factories.)
Number of Factories Q = 100
1
360
2
540
3
720
Q = 200
200
300
400
.
Average Total Cost
(Dollars per bike)
Q = 300
Q = 400
240
160
160
160
160
240
Q = 500 Q = 600
400
720
300
540
200
360
Suppose Ike's Bikes is currently producing 500 bikes per month in its only factory. Its short-run average total cost is $
per bike.
Suppose Ike's Bikes is expecting to produce 500 bikes per month for several years. In this case, in the long run, it would choose to produce bikes
using
Q Search this course
Ⓒ
On the following graph, plot the three SRATC curves for Ike's Bikes from the previous table. Specifically, use the green points (triangle symbol) to plot
its SRATC curve if it operates one factory (SRATC₁); use the purple points (diamond symbol) to plot its SRATC curve if it operates two factories (
OLD
O
X
7:59 PM
7/11/2022
Expert Solution
arrow_forward
Introduction:
The average total cost is determined by dividing the total production cost by the total output. In other words, the average cost is the total fixed and variable costs of the firm divided by the total number of units produced. Using the average total cost, production managers determine which level of production can increase profitability. To calculate the total cost of production per unit produced, the average total cost accounts for both fixed and variable costs.
Step by stepSolved in 2 steps with 1 images

Knowledge Booster
Learn more about
Need a deep-dive on the concept behind this application? Look no further. Learn more about this topic, economics and related others by exploring similar questions and additional content below.Similar questions
- Nonearrow_forwardWhich of the curves in the following graph is the average total cost curve?arrow_forwardFill in the space (d) in the table below associated with the firm William Perry, Inc., that delivers refrigerators in the Chicago area, using the two inputs of labor and trucks. Number of Amount of Trucks Labor 2 2 2 2 2 2 2 0 1 2 3456 Total Output 0 75 (c) 380 (f) Average Product of Labor (a) (b) 100 (d) (e) 75 Marginal Product of Labor 100 50 (g) 0arrow_forward
- Section 11.5 The Short-Run and Long-Run Average Total Cost Curves exhibit 1 SRATC for small plant SRATC for medium plant SRATC tor large plant LRATC B $500 $400 Economies of Scale Constant Returns to Saie 1,000 1,200 Quantity of Computers (per day) Notice that the long-run average total cost (LRATC) curve is much flatter than the short-run average total cost (SRATC) curve. This is because firms can be more flexible in the long run-they can choose which short-run cost curve they want to operate along, by choosing their plant scale. But they cannot do this in the short run, during which they are stuck with their existing short-run cost curve. That is, in the short run, the firm operates with the short-run curve it has based on past decisions. However, in the lang run, the firm is able to choose the short-run curve it wants to use. In Exhibit 1 above, explain why the curve between A and B looks different than the curve from A to C. Provide an example of how a firm could opt to follow the…arrow_forwardips Under decreasing returns to scale, average cost cost curve. as the quantity produced increases. Over this range of output, the marginal cost curve is Grade It Now the average Save & Continuearrow_forwardCosts and Profit Maximization: Work It Out 1 Suppose Margie decides to lease a photocopier and open up a black-and-white photocopying service in her dorm room for use by faculty and students. Her total cost, as a function of the number of copies she produces per month, is given in the table. Number of Photocopies Per Month Total Cost Fixed Cost Variable Cost Total Revenue Profit 0 $100 1,000 $110 2,000 $125 3,000 $145 4,000 $175 5,000 $215 6,000 $285 a. Fill in the missing numbers in the table, assuming that Margie can charge 6 cents per black-and-white copy. Margie's fixed cost is: $ Variable cost, 0 photocopies/month: $ Variable cost, 1,000 photocopies/month: $ Variable cost, 2,000 photocopies/month: $ Variable cost, 3,000 photocopies/month: $ Variable cost, 4,000 photocopies/month: $…arrow_forward
- shows the long-run average costs for Inmode, a manufacturer of Internet modems. Quantity per Day Average Cost ($) a) At what output is minimum efficient scale achieved? Output: b) with what output do diseconomies of scale begin? Output: 1 95 2 85 3 75 4 70 5 65 6 65 7 75 8 100arrow_forwardsolution plzarrow_forwardWhich of the following statements about average and marginal cost is INCORRECT? (2)(1) The marginal cost curve cuts both the average cost and average variable costcurves at their minimum points;(2) The marginal cost curve cuts both the average fixed cost and average variablecost curves at their minimum points;(3) The marginal cost curve lies below the average cost curve when average costis decreasing;(4) Marginal cost is the change in total cost when one extra unit of output isproduced.arrow_forward
arrow_back_ios
arrow_forward_ios
Recommended textbooks for you

 Principles of Economics (12th Edition)EconomicsISBN:9780134078779Author:Karl E. Case, Ray C. Fair, Sharon E. OsterPublisher:PEARSON
 Engineering Economy (17th Edition)EconomicsISBN:9780134870069Author:William G. Sullivan, Elin M. Wicks, C. Patrick KoellingPublisher:PEARSON
 Principles of Economics (MindTap Course List)EconomicsISBN:9781305585126Author:N. Gregory MankiwPublisher:Cengage Learning
 Managerial Economics: A Problem Solving ApproachEconomicsISBN:9781337106665Author:Luke M. Froeb, Brian T. McCann, Michael R. Ward, Mike ShorPublisher:Cengage Learning
 Managerial Economics & Business Strategy (Mcgraw-...EconomicsISBN:9781259290619Author:Michael Baye, Jeff PrincePublisher:McGraw-Hill Education


Principles of Economics (12th Edition)
Economics
ISBN:9780134078779
Author:Karl E. Case, Ray C. Fair, Sharon E. Oster
Publisher:PEARSON

Engineering Economy (17th Edition)
Economics
ISBN:9780134870069
Author:William G. Sullivan, Elin M. Wicks, C. Patrick Koelling
Publisher:PEARSON

Principles of Economics (MindTap Course List)
Economics
ISBN:9781305585126
Author:N. Gregory Mankiw
Publisher:Cengage Learning

Managerial Economics: A Problem Solving Approach
Economics
ISBN:9781337106665
Author:Luke M. Froeb, Brian T. McCann, Michael R. Ward, Mike Shor
Publisher:Cengage Learning

Managerial Economics & Business Strategy (Mcgraw-...
Economics
ISBN:9781259290619
Author:Michael Baye, Jeff Prince
Publisher:McGraw-Hill Education