
MATLAB: An Introduction with Applications
6th Edition
ISBN: 9781119256830
Author: Amos Gilat
Publisher: John Wiley & Sons Inc
expand_more
expand_more
format_list_bulleted
Related questions
Topic Video
Question
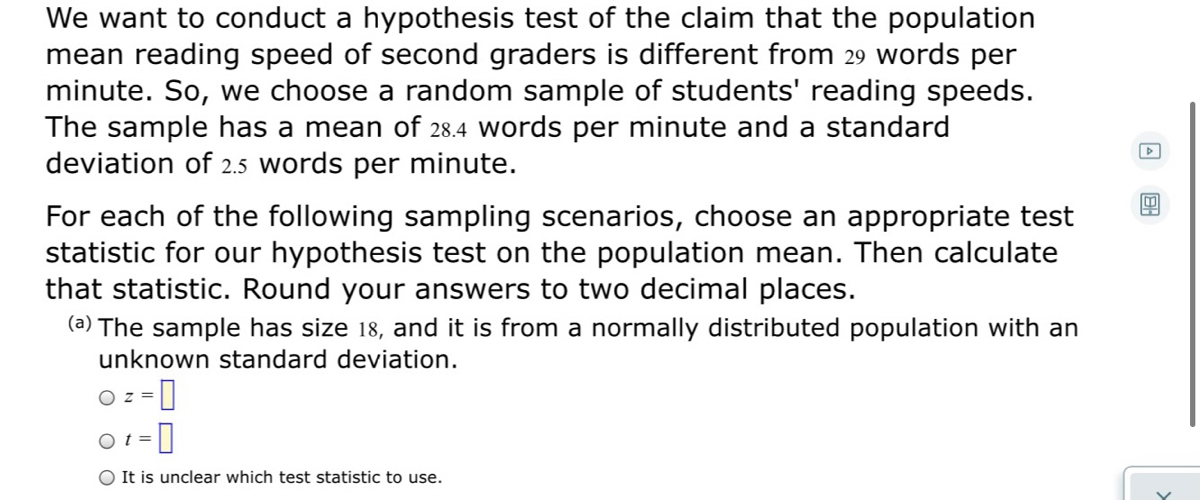

Transcribed Image Text:We want to conduct a hypothesis test of the claim that the population
mean reading speed of second graders is different from 29 words per
minute. So, we choose a random sample of students' reading speeds.
The sample has a mean of 28.4 words per minute and a standard
deviation of 2.5 words per minute.
For each of the following sampling scenarios, choose an appropriate test
statistic for our hypothesis test on the population mean. Then calculate
that statistic. Round your answers to two decimal places.
(a) The sample has size 18, and it is from a normally distributed population with an
unknown standard deviation.
O z =
O It is unclear which test statistic to use.

Transcribed Image Text:unknown standard devlation.
O z =
O t =
O It is unclear which test statistic to use.
(b) The sample has size 13, and it is from a normally distributed population with a
known standard deviation of 3.3.
= z O
O t =
O It is unclear which test statistic to use.
Expert Solution
This question has been solved!
Explore an expertly crafted, step-by-step solution for a thorough understanding of key concepts.

This is a popular solution

Trending nowThis is a popular solution!

Step by stepSolved in 3 steps

Knowledge Booster


Learn more about
Need a deep-dive on the concept behind this application? Look no further. Learn more about this topic, statistics and related others by exploring similar questions and additional content below.Similar questions
- Understanding Normal Distributions: Z-Scores A normal distribution has a mean of 107 and a standard deviation of 6. Find the z-score for the data value of 101. Round answer to two decimal places.z =arrow_forwardA population mean is 13. The sample mean is 12.8, and the sample standard deviation is 2. The sample size is 20. What standard error would you use to conduct a hypothesis test on the mean?arrow_forward2arrow_forward
- Each person in random samples of 227 male and 293 female working adults living in a certain town in Canada was asked how long, in minutes, his or her typical daily commute was. Is there enough evidence to show that there is a difference in mean commute times for male and female working residents of this town? (Use males females) Male Female Sample size X S Sample size x S 227 30.2 24.0 293 27.9 24.3 Find the test statistic. (Round your answer to two decimal places.) Find the df. (Round your answer down to the nearest whole number.) df= Use technology to find the P-value. (Round your answer to four decimal places.) P-value= Is there enough evidence to show that there is a difference in mean commute times for male and female working residents of this town? Use a significance level of 0.05. Yes Noarrow_forwardProfessor Nord stated that the mean score on the final exam from all the years he has been teaching is a 79%. Colby was in his most recent class, and his class’s mean score on the final exam was 82%. Colby decided to run a hypothesis test to determine if the mean score of his class was significantly greater than the mean score of the population. α = .01. What is the mean score of the population? What is the mean score of the sample? Is this test one-tailed or two-tailed? Why?arrow_forwardSarah thinks that she has lost interest in online shopping. Based on her shopping history, she can see that her average purchases in the past were about 4 items on average each week. Since this last month, she can now see that she has only purchased 2 items on average each week, (with a SD of 1). To determine whether her shopping habits have changed, what statistical test should be used here?arrow_forward
- HOW DO I SKETCH THE LOCATIONarrow_forwardState the null and alternate hypothesis. Will you use a left tail, right tail or 2 tailed test? Identify the sampling distribution to be used: standard normal, Student’s t or chi squared. Find the value of the test statistic. Find the P-Value. Based on your answers, shall we reject or accept the null hypothesis? Write the conclusion in the context of the problem.arrow_forwardof 23 Step 1 of 1 Question 10 Four scenarios of statistical studies are given below. Decide which study uses a sample statistic. 01:26:15 An estimated 15% of Americans don't use the internet. Keypad Keyboard Shortcuts The average finish time for the Ironman, Kona was 11:32 for the 1883 finishers, with an average swim time of 1:14, an average bike time of 5:53, and an average run time of 4:14. A study prompted by the increase in the use of assisted reproductive technology looked O at hospital records across the country. The report stated that an estimated 3.2 % of births in the U.S. last year resulted in twins. In a study of 89 of the children diagnosed with cancer at Leeland Memorial Hospital, 70 children were cancer-free five years after their first diagnosis.arrow_forward
arrow_back_ios
arrow_forward_ios
Recommended textbooks for you
- MATLAB: An Introduction with ApplicationsStatisticsISBN:9781119256830Author:Amos GilatPublisher:John Wiley & Sons Inc
 Probability and Statistics for Engineering and th...StatisticsISBN:9781305251809Author:Jay L. DevorePublisher:Cengage Learning
 Statistics for The Behavioral Sciences (MindTap C...StatisticsISBN:9781305504912Author:Frederick J Gravetter, Larry B. WallnauPublisher:Cengage Learning
  Elementary Statistics: Picturing the World (7th E...StatisticsISBN:9780134683416Author:Ron Larson, Betsy FarberPublisher:PEARSON
 The Basic Practice of StatisticsStatisticsISBN:9781319042578Author:David S. Moore, William I. Notz, Michael A. FlignerPublisher:W. H. Freeman
 Introduction to the Practice of StatisticsStatisticsISBN:9781319013387Author:David S. Moore, George P. McCabe, Bruce A. CraigPublisher:W. H. Freeman
MATLAB: An Introduction with Applications
Statistics
ISBN:9781119256830
Author:Amos Gilat
Publisher:John Wiley & Sons Inc
Probability and Statistics for Engineering and th...
Statistics
ISBN:9781305251809
Author:Jay L. Devore
Publisher:Cengage Learning
Statistics for The Behavioral Sciences (MindTap C...
Statistics
ISBN:9781305504912
Author:Frederick J Gravetter, Larry B. Wallnau
Publisher:Cengage Learning
Elementary Statistics: Picturing the World (7th E...
Statistics
ISBN:9780134683416
Author:Ron Larson, Betsy Farber
Publisher:PEARSON
The Basic Practice of Statistics
Statistics
ISBN:9781319042578
Author:David S. Moore, William I. Notz, Michael A. Fligner
Publisher:W. H. Freeman
Introduction to the Practice of Statistics
Statistics
ISBN:9781319013387
Author:David S. Moore, George P. McCabe, Bruce A. Craig
Publisher:W. H. Freeman