
MATLAB: An Introduction with Applications
6th Edition
ISBN: 9781119256830
Author: Amos Gilat
Publisher: John Wiley & Sons Inc
expand_more
expand_more
format_list_bulleted
Related questions
Topic Video
Question
Step 2 of 3:
Compute the value of the test statistic. Round your answer to three decimal places.
Step 3 of 3:
Draw a conclusion and interpret the decision.
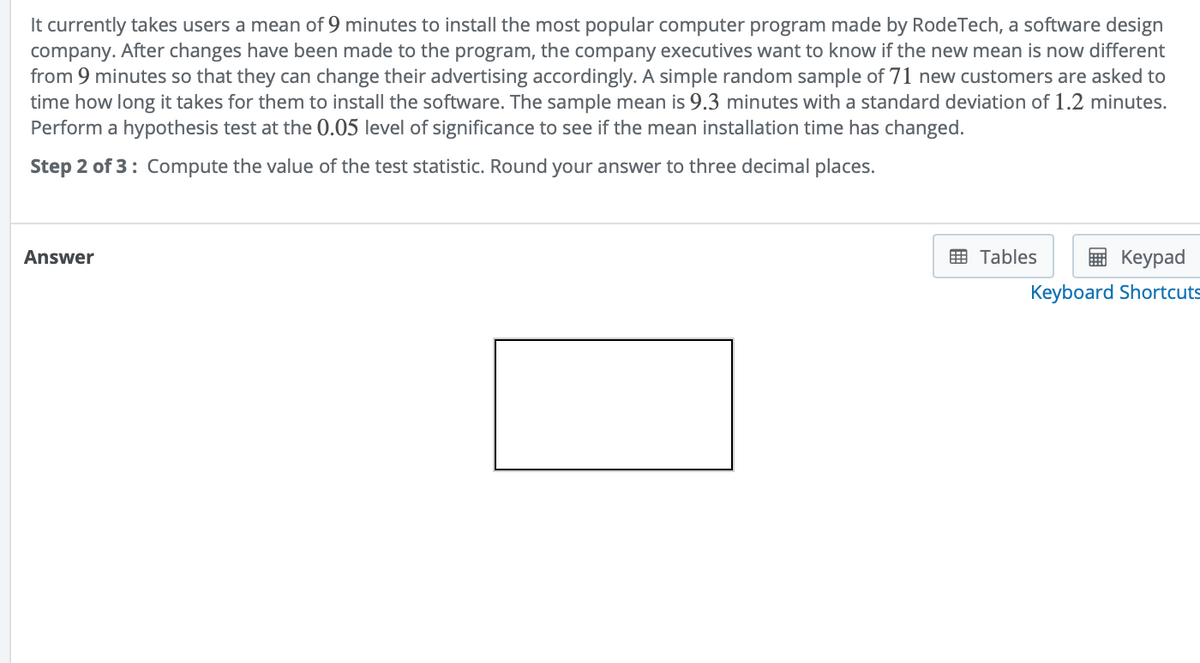

Transcribed Image Text:It currently takes users a mean of 9 minutes to install the most popular computer program made by RodeTech, a software design
company. After changes have been made to the program, the company executives want to know if the new mean is now different
from 9 minutes so that they can change their advertising accordingly. A simple random sample of 71 new customers are asked to
time how long it takes for them to install the software. The sample mean is 9.3 minutes with a standard deviation of 1.2 minutes.
Perform a hypothesis test at the 0.05 level of significance to see if the mean installation time has changed.
Step 2 of 3: Compute the value of the test statistic. Round your answer to three decimal places.
Answer
E Tables
Keypad
Keyboard Shortcuts
Expert Solution
This question has been solved!
Explore an expertly crafted, step-by-step solution for a thorough understanding of key concepts.

This is a popular solution

Trending nowThis is a popular solution!

Step by stepSolved in 2 steps with 2 images

Knowledge Booster


Learn more about
Need a deep-dive on the concept behind this application? Look no further. Learn more about this topic, statistics and related others by exploring similar questions and additional content below.Similar questions
- Quit smoking: A recent study reported that in a sample of 234 European-American HIV-positive smokers, 105 of them had used a nicotine patch to try to quit smoking, and in a sample of 81 Hispanic-American HIV-positive smokers, 25 had used a nicotine patch. Can you conclude that the proportion of patch users is greater among European-Americans? Let p₁ denote the proportion of European-Americans who used the patch. Use the a=0.01 level of significance. Part 1 of 4 (a) State the appropriate null and alternate hypotheses. Ho: P₁ (Choose one) ▼ P₂ H₁: P₁ (Choose one) P2 This is a (Choose one) test. Part 2 of 4 (b) Find the P-value. Round the answer to four decimal places. P-value= X S Śarrow_forwardYou are testing the claim that the proportion of men who own cats is larger than the proportion of women who own cats. You sample 110 men, and 25% own cats. You sample 150 women, and 85% own cats. Find p (p-bar), as a decimal, rounded to two decimal places.arrow_forwardq16arrow_forward
- When manually calculating a Mann-Whitney analysis, the first step is to organize your data in numerical order, from lowest to highest. Which of the following statements is true about this step in the analysis process. Group of answer choices The data should be squared before you sum the data. The data from both groups should be combined before ranking the data. The data should be summed (added) before ranking the data. The data should be ranked with each group independently.arrow_forwardtypingarrow_forwardces An article reports that in a sample of 124 nurses, 53 said that a busy workload had a positive effect on their enjoyment of their job. Can you conclude that less than 45% of nurses feel that a busy workload has a positive effect on their enjoyment of their job? Find the P- value and state a conclusion. The P-value is We (Click to select) conclude that less than 45% of nurses feel that a busy workload has a positive effect on their enjoyment of their job.arrow_forward
- Need help finding test statistic and p-value. See the photo for problem.arrow_forwardHOW Do I solve this in EXCEL In 2016, the Better Business Bureau (BBB) settled 80% of complaints they received in the US. Suppose you have been hired by the BBB to investigate the complains they received this year involving new car dealers. You plan to select a sample of new car dealer complaints to estimate the proportion of complaints the BBB is able to settle. Assume the population proportion of complaints settled for new car dealers is 0.8, the same as the overall proportion of complaints settled in 2016. Suppose you select a sample of 200 complaints involving new car dealers. Show the sampling distribution of pbar. Based on a sample of 200 complaints, what is the probability that the sample proportion will be within 0.04 of the population proportion? Suppose you select a sample of 450 complaints involving new car dealers. Show the sampling distribution of pbar. Based on the smaller sample of only 450 complaints, what is the probability that the sample proportion will be within…arrow_forwardYou are testing the claim that the proportion of men who own cats is larger than the proportion of women who own cats.You sample 90 men, and 50% own cats.You sample 130 women, and 15% own cats.Find ¯p (p-bar), as a decimal, rounded to two decimal places.arrow_forward
- Net Worth. The Board of Governors of the Federal Reserve System publishes information on family net worth in the Survey of Consumer Finances. In 2010, the mean net worth of families in the United States was $498.8 thousand and the median net worth was $77.3 thousand. Which measure of center do you think is more appropriate? Explain your answer.arrow_forwardind the number of successes x suggested by the given statement: From a CNN/USA Today/Gallup poll: Among 1299 survey subjects, 13.7 % say that the opinion of a celebrity would influence their own opinion. x = nothing (round off to a whole number)arrow_forward
arrow_back_ios
arrow_forward_ios
Recommended textbooks for you
- MATLAB: An Introduction with ApplicationsStatisticsISBN:9781119256830Author:Amos GilatPublisher:John Wiley & Sons Inc
 Probability and Statistics for Engineering and th...StatisticsISBN:9781305251809Author:Jay L. DevorePublisher:Cengage Learning
 Statistics for The Behavioral Sciences (MindTap C...StatisticsISBN:9781305504912Author:Frederick J Gravetter, Larry B. WallnauPublisher:Cengage Learning
  Elementary Statistics: Picturing the World (7th E...StatisticsISBN:9780134683416Author:Ron Larson, Betsy FarberPublisher:PEARSON
 The Basic Practice of StatisticsStatisticsISBN:9781319042578Author:David S. Moore, William I. Notz, Michael A. FlignerPublisher:W. H. Freeman
 Introduction to the Practice of StatisticsStatisticsISBN:9781319013387Author:David S. Moore, George P. McCabe, Bruce A. CraigPublisher:W. H. Freeman
MATLAB: An Introduction with Applications
Statistics
ISBN:9781119256830
Author:Amos Gilat
Publisher:John Wiley & Sons Inc
Probability and Statistics for Engineering and th...
Statistics
ISBN:9781305251809
Author:Jay L. Devore
Publisher:Cengage Learning
Statistics for The Behavioral Sciences (MindTap C...
Statistics
ISBN:9781305504912
Author:Frederick J Gravetter, Larry B. Wallnau
Publisher:Cengage Learning
Elementary Statistics: Picturing the World (7th E...
Statistics
ISBN:9780134683416
Author:Ron Larson, Betsy Farber
Publisher:PEARSON
The Basic Practice of Statistics
Statistics
ISBN:9781319042578
Author:David S. Moore, William I. Notz, Michael A. Fligner
Publisher:W. H. Freeman
Introduction to the Practice of Statistics
Statistics
ISBN:9781319013387
Author:David S. Moore, George P. McCabe, Bruce A. Craig
Publisher:W. H. Freeman