
MATLAB: An Introduction with Applications
6th Edition
ISBN: 9781119256830
Author: Amos Gilat
Publisher: John Wiley & Sons Inc
expand_more
expand_more
format_list_bulleted
Related questions
Question
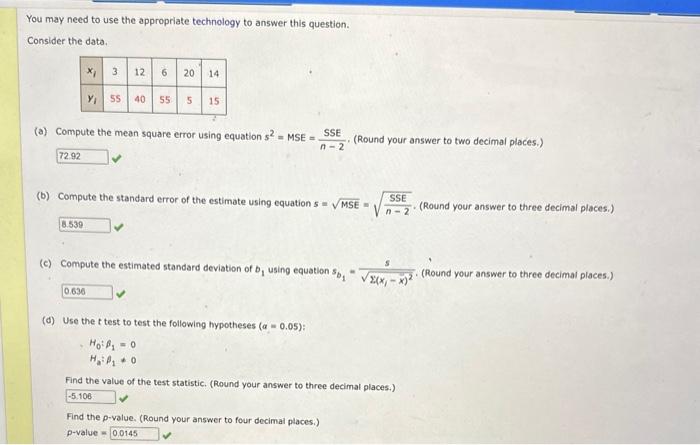

Transcribed Image Text:You may need to use the appropriate technology to answer this question.
Consider the data.
72.92
3
8.539
12 6
(a) Compute the mean square error using equation s2 = MSE=. SSE
n-2
20 14
0.636
Y₁ 55 40 55 5 15
(b) Compute the standard error of the estimate using equation s= √MSE=
(c) Compute the estimated standard deviation of
- (Round your answer to two decimal places.)
D₁ using equation Sp
(d) Use the t test to test the following hypotheses (a = 0.05):
Ho: P₁ = 0
Find the p-value. (Round your answer to four decimal places.)
p-value 0.0145
SSE
n-2
Find the value of the test statistic. (Round your answer to three decimal places.)
-5.106
(Round your answer to three decimal places.)
-√2X41-42.
T. (Round your answer to three decimal places.)

Transcribed Image Text:State your conclusion.
O Do not reject Ho. We cannot conclude that the relationship between x and y is
significant.
Reject Ho. We conclude that the relationship between x and y is significant.
O Do not reject Ho. We conclude that the relationship between x and y is significant.
O Reject Ho. We cannot conclude that the relationship between x and y is significant.
(e) Use the F test to test the hypotheses in part (d) at a 0.05 level of significance. Present the results in the analysis of variance table format.
Set up the ANOVA table. (Round your values for MSE and F to two decimal places, and your p-value to three decimal places.)
Source
of Variation
Regression 1901.25
Error
Sum
Degrees
of Squares of Freedom
Total
1901.25
Mean
Square
Find the value of the test statistic. (Round your answer to two decimal places.)
Find the p-value. (Round your answer to three decimal places.)
p-value=
p-value
State your conclusion.
Reject Ho. We conclude that the relationship between x and y is significant.
O Do not reject Ho. We cannot conclude that the relationship between x and y is significant.
O
Do not reject Ho. We conclude that the relationship between x and y is significant.
O Reject Ho. We cannot conclude that the relationship between x and y is significant.
Expert Solution
This question has been solved!
Explore an expertly crafted, step-by-step solution for a thorough understanding of key concepts.

This is a popular solution

Trending nowThis is a popular solution!

Step by stepSolved in 3 steps with 1 images

Knowledge Booster

Similar questions
- Consider the ANOVA table that follows. Analysis of Variance Source DF SS MS F Regression 2 3,947.18 1,973.59 42.48 Residual Error 47 2,183.37 46.45 Total 49 6,130.55 a-1. Determine the standard error of estimat About 95% of the residuals will be between what two values? (Round your answers to 2 decimal places. Determine the coefficient of multiple determination. (Round your answer to 3 decimal places.) Determine the percentage variation for the independent variables. (Round your answer to 1 decimal place.) Determine the coefficient of multiple determination, adjusted for the degrees of freedom. (Round your answer to 3 decimal places.)arrow_forwardNonearrow_forwardUse the following ANOVA table for regression to answer the questions. Analysis of Variance Source DF SS MS F P Regression 1 293.3 293.3 2.01 0.158 Residual Error 174 25386.6 145.9 Total 175 25679.9 The F-statistic is _____________.The p-value is ___________________arrow_forward
- Can u please answer this I will rateyouarrow_forwardI need help with these questions 1. do the covariates and factors interact? 2. can you conclude a homogeneity of regression slopes? 3. can you conclude homogeneity of variance?arrow_forwardAssume the samples are random and independent, the populations are nomally distributed, and the population variances are equal. The table available below shows the prices (in dollars) for a sample of automobile batteries. The prices are classified according to battery type. At a = 0.10, is there enough evidence conclude that at least one mean battery price is different from the others? Complete parts (a) through (e) below. E Click the icon to view the battery cost data. (a) Let u1. P2. H3 represent the mean prices for the group size 35, 65, and 24/24F respectively. Identify the claim and state Ho and H. H Cost of batteries by type The claim is the V hypothesis. Group size 35 Group size 65 Group size 24/24F 101 111 121 124 D 146 173 182 278 124 140 141 89 (b) Find the critical value, Fo, and identify the rejection region. 90 79 84 The rejection region is F Fo, where Fo = (Round to two decimal places as needed.) (c) Find the test statistic F. Print Done F= (Round to two decimal places as…arrow_forward
- Use the following ANOVA table for regression to answer the questions. Analysis of Variance Source DF SS MS F P Regression 1 291.4 291.4 2.01 0.158 Residual Error 174 25230.0 145.0 Total 175 25521.4 Give the F-statistic and p-value.Enter the exact answers.The F-statistic is =The p-value is =arrow_forwardTen observations were selected from each of 3 populations, and an analysis of variance was performed on the data. The following are the results: Source of Variation Sum of Squares Degrees of Freedom Mean Square F Between Treatments 18.24 Within Treatments(error) 158.4 Using level of significance =.05, test to see if there is a significance difference among the means of the three populations. If in (1) you concluded that at least one mean is different from the others, determine which mean is different. The three sample means are X1= 24.8, X2=23.4, and X3=27.4. Use Fisher’s LSD procedure and let level of significance=.05arrow_forwardThis output represents the hypothesis test that the average age at first pregnancy of women diagnosed with breast cancer is different depending on whether or not metastases are present (yes or no) at the time of breast cancer diagnosis.arrow_forward
- A test statistic for one of the tests in this unit is given, along with information about degrees of freedom. Give the p-value and indicate whether the results are significant at the 5% level. An analysis of variance test with F-statistic 8.71 and df -numerator 3 and df -denominator = 17 Round your answer to four decimal places. p-valuearrow_forwardWhich would be the appropriate way to test differences in proportions for more than two samples? t-test if variance is unknown z-test paired t-test F-test for equality of variances cross-tabulation procedure to conduct a chi-square testarrow_forwardRefer to the ANOVA table for this regression. Source SS d.f. MS Regression 1,164,578 5 232,916 Residual 1,500,689 45 33,349 Total 2,665,267 50 (a) State the degrees of freedom for the F test for overall significance.arrow_forward
arrow_back_ios
SEE MORE QUESTIONS
arrow_forward_ios
Recommended textbooks for you
- MATLAB: An Introduction with ApplicationsStatisticsISBN:9781119256830Author:Amos GilatPublisher:John Wiley & Sons Inc
 Probability and Statistics for Engineering and th...StatisticsISBN:9781305251809Author:Jay L. DevorePublisher:Cengage Learning
 Statistics for The Behavioral Sciences (MindTap C...StatisticsISBN:9781305504912Author:Frederick J Gravetter, Larry B. WallnauPublisher:Cengage Learning
  Elementary Statistics: Picturing the World (7th E...StatisticsISBN:9780134683416Author:Ron Larson, Betsy FarberPublisher:PEARSON
 The Basic Practice of StatisticsStatisticsISBN:9781319042578Author:David S. Moore, William I. Notz, Michael A. FlignerPublisher:W. H. Freeman
 Introduction to the Practice of StatisticsStatisticsISBN:9781319013387Author:David S. Moore, George P. McCabe, Bruce A. CraigPublisher:W. H. Freeman
MATLAB: An Introduction with Applications
Statistics
ISBN:9781119256830
Author:Amos Gilat
Publisher:John Wiley & Sons Inc
Probability and Statistics for Engineering and th...
Statistics
ISBN:9781305251809
Author:Jay L. Devore
Publisher:Cengage Learning
Statistics for The Behavioral Sciences (MindTap C...
Statistics
ISBN:9781305504912
Author:Frederick J Gravetter, Larry B. Wallnau
Publisher:Cengage Learning
Elementary Statistics: Picturing the World (7th E...
Statistics
ISBN:9780134683416
Author:Ron Larson, Betsy Farber
Publisher:PEARSON
The Basic Practice of Statistics
Statistics
ISBN:9781319042578
Author:David S. Moore, William I. Notz, Michael A. Fligner
Publisher:W. H. Freeman
Introduction to the Practice of Statistics
Statistics
ISBN:9781319013387
Author:David S. Moore, George P. McCabe, Bruce A. Craig
Publisher:W. H. Freeman