MATLAB: An Introduction with Applications
6th Edition
ISBN: 9781119256830
Author: Amos Gilat
Publisher: John Wiley & Sons Inc
expand_more
expand_more
format_list_bulleted
Question

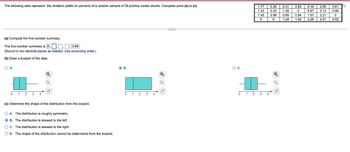
Transcribed Image Text:The following data represent the dividend yields (in percent) of a random sample of 28 publicly traded stocks. Complete parts (a) to (c)
(a) Compute the five-number summary.
The five-number summary is 0... 3.66.
(Round to two decimal places as needed. Use ascending order.)
(b) Draw a boxplot of the data.
OA.
61
3
7
Q
(c) Determine the shape of the distribution from the boxplot.
OA. The distribution is roughly symmetric.
B. The distribution is skewed to the left.
OC. The distribution is skewed to the right.
OD. The shape of the distribution cannot be determined from the boxplot.
B.
1 2
3
O C.
6 4
2
اداداد
Hulda
1.45
0
1.77 0.26
1.22 0.23 1.39
H
▬▬▬▬▬
G
Jo N
NADO
HHH
0.31 2.83 0.18 2.59 0.61
°°°
0
3.66 0.69 0.94 1.57 3.21 0
0
1.24
0.67 3.12 0.06
1.42 2.26 2.51 0.52
Expert Solution
This question has been solved!
Explore an expertly crafted, step-by-step solution for a thorough understanding of key concepts.
Step by stepSolved in 4 steps with 20 images

Knowledge Booster
Similar questions
- Use a stem-and-leaf plot to display the data, which represent the thickness (in centimeters) of ice measured at 20 different locations on a frozen lake. Describe any patterns. 5.8 6.3 6.9 7.2 5.1 4.9 4.6 5.8 7.0 6.8 8.2 7.5 7.2 5.8 7.2 8.0 7.4 6.9 5.9 4.9 Determine the leaves in the stem-and-leaf plot below. Key: 3|3 = 3.3 Ice Thickness 6| 8 What best describes the data? A. Most thicknesses are greater than 7 centimeters. B. Most thicknesses are 6 centimeters. C. Most thicknesses are between 5 and 8 centimeters. D. Most thicknesses are less than 5 centimeters.arrow_forwardA. Determine the coefficient of determination, r2, and interpret its meaning. (Fill in the Blank) r2 = ___? (Round to four decimal places as needed.) B. What is the meaning of the coefficient ofdetermination? (Choose Below) A. It measures the variability in the actual plate gap from the predicted plate gap. B. It measures the variability in the actual tear rating from the predicted tear rating. C. It is the proportion of the variation in the plate gap that is explained by the variability in the tear rating. D. It is the proportion of the variation in the tear rating that is explained by the variability in the plate gap. C. Determine the standard error of the estimate. SYX = ___? (Round to four decimal places asneeded.)arrow_forwardMilaaanarrow_forward
- R A veterinarian recorded how many kittens were born in each litter. This data is summarized in the L histogram below. (Note: The last class actually represents "7 or more kittens," not just 7 kittens.) 14 12 10- 8- 6- 4 1 2 3 4 7 8 # of kittens What is the frequency of litters having at most 3 kittens? ans = Fe Ro 1 FEB 18 P. W MacBook Air 20 000 esc F5 F6 F2 F3 F4 F1 & ! @ 1 2 4 5 Q W R %24 # 3 6 2. Frequencyarrow_forwardWhat is: Lower bound Upper bound Suppose a child has a height of 26.5 inches. What would be a good guess for the child's head circumference?arrow_forwardThe box plotarrow_forward
- A physics professor wishes to compare quiz grades between her two classes. The quiz was worth 10 points. The dot plots show the grade distributions. 4 10 9. Class A 10 Class B Each dot represents a What was the lowest quiz grade in Class A? What was the highest quiz grade in Class 8?arrow_forwardb. Calculate the range. Range= c. Calculate the interquartile range, IQR. IQR= d. State whether the distribution is symmetric, skewed left, or skewed right. Symmetric Skewed left Skewed right e. Would you expect the mean to be greater than, equal, or less than the median? Equal Greater than Less thanarrow_forward
arrow_back_ios
arrow_forward_ios
Recommended textbooks for you
 MATLAB: An Introduction with ApplicationsStatisticsISBN:9781119256830Author:Amos GilatPublisher:John Wiley & Sons Inc
 Probability and Statistics for Engineering and th...StatisticsISBN:9781305251809Author:Jay L. DevorePublisher:Cengage Learning
 Statistics for The Behavioral Sciences (MindTap C...StatisticsISBN:9781305504912Author:Frederick J Gravetter, Larry B. WallnauPublisher:Cengage Learning
 Elementary Statistics: Picturing the World (7th E...StatisticsISBN:9780134683416Author:Ron Larson, Betsy FarberPublisher:PEARSON
 The Basic Practice of StatisticsStatisticsISBN:9781319042578Author:David S. Moore, William I. Notz, Michael A. FlignerPublisher:W. H. Freeman
 Introduction to the Practice of StatisticsStatisticsISBN:9781319013387Author:David S. Moore, George P. McCabe, Bruce A. CraigPublisher:W. H. Freeman

MATLAB: An Introduction with Applications
Statistics
ISBN:9781119256830
Author:Amos Gilat
Publisher:John Wiley & Sons Inc

Probability and Statistics for Engineering and th...
Statistics
ISBN:9781305251809
Author:Jay L. Devore
Publisher:Cengage Learning

Statistics for The Behavioral Sciences (MindTap C...
Statistics
ISBN:9781305504912
Author:Frederick J Gravetter, Larry B. Wallnau
Publisher:Cengage Learning

Elementary Statistics: Picturing the World (7th E...
Statistics
ISBN:9780134683416
Author:Ron Larson, Betsy Farber
Publisher:PEARSON

The Basic Practice of Statistics
Statistics
ISBN:9781319042578
Author:David S. Moore, William I. Notz, Michael A. Fligner
Publisher:W. H. Freeman

Introduction to the Practice of Statistics
Statistics
ISBN:9781319013387
Author:David S. Moore, George P. McCabe, Bruce A. Craig
Publisher:W. H. Freeman