
Related questions
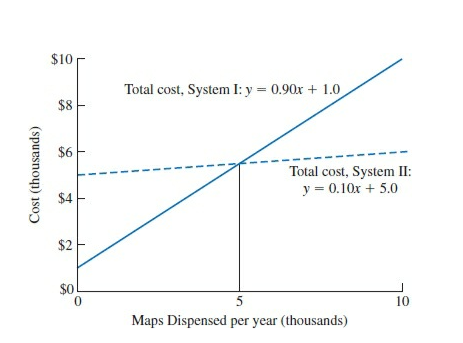
Two automatic systems for dispensing maps are being compared by the state highway department. The accompanying breakeven chart of the comparison of these systems (System I vs. System II) shows total yearly costs for the number of maps dispensed per year for both alternatives. Answer the following questions. (a) What is the fixed cost for System I? (b) What is the fixed cost for System II? (c) What is the variable cost per map dispensed for System I? (d) What is the variable cost per map dispensed for System II? (e) What is the breakeven point in terms of maps dispensed at which the two systems have equal annual costs? (f) For what range of annual number of maps dispensed is System I recommended? (g) For what range of annual number of maps dispensed is System II recommended? (h) At 3000 maps per year, what are the marginal and average map costs for each system?


Trending nowThis is a popular solution!

Step by stepSolved in 2 steps


- What life cycle cost concept begins raising concerns by year 5 with any electric vehicle (EV)? If that issue affected resale value at year 5, would that affect perceived value-in-use? How exactly?arrow_forwardPlot the logarithm of arrivals for each transportation mode against time, all on the same graph. Which now appears to be growing the fastest?arrow_forwardConcert Opportunity Cost 2 You were able to purchase two tickets to an upcoming concert for $100 apiece when the concert was first announced three months ago. Recently, you saw that StubHub was listing similar seats for $225 apiece. What does it cost you to attend the concert?arrow_forward
- Exercise A3 What dome slices of a pie chart represent?arrow_forwardMetropolitan Hospital has estimated its average monthly bed needs as N=1,000+9X where X=timeperiod(months);January2002=0 N=monthlybedneeds Assume that no new hospital additions are expected in the area in the foreseeable future. The following monthly seasonal adjustment factors have been estimated, using data from the past five years: Forecast Metropolitans bed demand for January, April, July, November, and December 2007. If the following actual and forecast values for June bed demands have been recorded, what seasonal adjustment factor would you recommend be used in making future June forecasts?arrow_forwardWhat are explicit and implicit costs?arrow_forward
- Furniture Forecasting Futura Furniture Products manufactures upscale office furniture for the Office of the Future. The sales division comprises regionally based sales offices made up of sales representatives and regional managers. Sales representativeswho report to the regional managersconduct direct sales efforts with customers in their regions. As part of the sales process, representatives gather information about likely future orders and convey that information back to the regional managers. Regional managers use that information to create sales forecasts, which are then used as the basis for manufacturing schedules. Sales representatives and regional managers are both compensated on a salary plus commission (percentage of revenue as pricing is centrally controlled). However, a regional managers commission is adjusted based on regional sales that exceed the forecasted budget. Corporate managers are concerned with one of Futuras key products, the DeskPod. They worry that DeskPod forecasts are inaccurate, causing extreme havoc in the manufacturing process. How are the forecasts likely to be inaccurate? What do you think is driving this inaccuracy? How might this problem be solved?arrow_forwardGo to this website (http://www.measuringworth.com/ppowerus/) for the Purchasing Power Calculator at measuringWorth.com. How much money would it take today to purchase what one dollar would have bought in the year of your birth?arrow_forwardWhat is a production technology?arrow_forward
 Managerial Economics: A Problem Solving ApproachEconomicsISBN:9781337106665Author:Luke M. Froeb, Brian T. McCann, Michael R. Ward, Mike ShorPublisher:Cengage Learning
 Managerial Economics: Applications, Strategies an...EconomicsISBN:9781305506381Author:James R. McGuigan, R. Charles Moyer, Frederick H.deB. HarrisPublisher:Cengage Learning
 Economics Today and Tomorrow, Student EditionEconomicsISBN:9780078747663Author:McGraw-HillPublisher:Glencoe/McGraw-Hill School Pub Co
