
A First Course in Probability (10th Edition)
10th Edition
ISBN: 9780134753119
Author: Sheldon Ross
Publisher: PEARSON
expand_more
expand_more
format_list_bulleted
Related questions
Concept explainers
Topic Video
Question
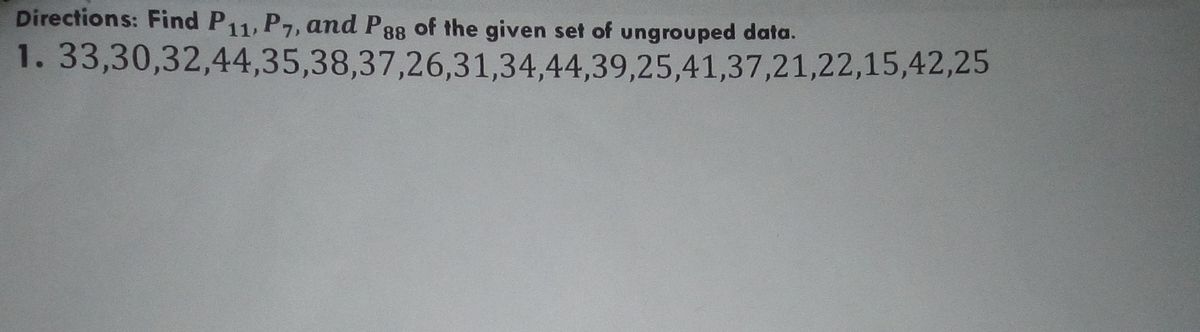

Transcribed Image Text:Directions: Find P11, P7, and P88 of the given set of ungrouped data.
1.33,30,32,44,35,38,37,26,31,34,44,39,25,41,37,21,22,15,42,25
Expert Solution
This question has been solved!
Explore an expertly crafted, step-by-step solution for a thorough understanding of key concepts.

This is a popular solution

Trending nowThis is a popular solution!

Step by stepSolved in 2 steps

Knowledge Booster


Learn more about
Need a deep-dive on the concept behind this application? Look no further. Learn more about this topic, probability and related others by exploring similar questions and additional content below.Similar questions
- Here is a set of data. 66 105 119 230 240 365 456 507 620 704 742 871 944 964 Identify the 5 number summary (min, Q1, median, Q3, max)arrow_forward8. Draw an example of a data set that would show each description. (Draw your example above the description.) uniform right skewed bimodal unimodal, centered left skewedarrow_forwardHere are the reading scores (out of 60) of 20 randomly selected kindergarten kids in a district 34, 26, 46, 46, 43, 42, 45, 39, 43, 32, 15, 36, 29, 39, 41, 27, 38, 58, 31, 35 Find the 5-number summary for the data set. Min: 15 Q1: OF 58 Find the IQR of the data set. IQR: 11.7 x Find Q3+1.5(IQR).! Q3+1.5(IQR) = 60.6 X Median: 38.5 38.5 Q3: 43 043 Max: 58 Are there any high outliers, that is, are there any numbers in the data set higher than Q3+1.5(IQR)? No, there are no high outliers ✓ OB Find Q₁-1.5(IQR). Q₁-1.5(IQR) Are there any low outliers, that is, are there any numbers in the data set higher than Q₁— 1.5(IQR)? No, there are no low outliers ✓ = 25.3 Xarrow_forward
- Here is a set of data. 43 47 132 160 179 265 440 604 636 670 803 813 814 893 914 917 Identify the 5 number summary (min, Q1, median, Q3, max)arrow_forwardHere is a set of data. 56 206 247 287 293 343 404 411 430 506 522 664 770 829 857 865 884 983 Identify the 5 number summary (min, Q1, median, Q3, max) Hint: Help Video [+] Submit Questionarrow_forwardHere is a set of data. 6 7 260 301 338 417 504 623 649 714 867 907 Identify the 5 number summary (min, Q1, median, Q3, max) , , , ,arrow_forward
- Use the given minimum and maximum data entries, and the number of classes, to find the class width, the lower class limits, and the upper class limits. minimum = 13, maximum = 78, 6 classes The class width is Choose the correct lower class limits below. OA. 13, 24, 35, 46, 57, 68 OB. 23, 34, 46, 56, 67, 78 O C. 13, 23, 35, 45, 56, 68 OD. 24, 34, 46, 57, 68, 78 Choose the correct upper class limits below. OA. 24, 35, 45, 56, 68, 78 OB. 23, 34, 45, 56, 67, 78 OC. 24, 35, 46, 57, 68, 78 OD. 23, 34, 46, 57, 67, 78arrow_forwardHere is a set of data. 11 199 208 352 418 628 788 792 821 937 946 972 Identify the 5 number summary (min, Q1, median, Q3, max)arrow_forwardHere is a set of data. 134 317 350 504 521 629 711 732 744 Identify the 5 number summary (min, Q1, median, Q3, max) 892 914 938 943 968arrow_forward
- −13,−13,−13,0,0,0,11−13,−13,−13,0,0,0,11 Determine if the data set is unimodal, bimodal, multimodal, or has no mode. Identify the mode(s), if any exist.arrow_forwardHere is a set of data. 11 126 192 442 466 508 556 589 660 715 807 823 832 998 Identify the 5 number summary (min, Q1, median, Q3, max)arrow_forward1 #+= ABC The following are the ages of 13 mathematics teachers in a school district. 33, 34, 35, 37, 39, 42, 49, 50, 52, 53, 53, 56, 59 Notice that the ages are ordered from least to greatest. Give the five-number summary and the interquartile range for the data set. Five-number summary 8 Minimum: Lower quartile: Median: Upper quartile: Maximum: Interquartile range: ↑ 2 § % X £ # 1 3 0 S ¥ $ 4 + & 5 = * 6 ( ; 7 ) 8 I ! I 9 "1 undo ? 0 Español ABC ? F D 1 Aa V < retur #-arrow_forward
arrow_back_ios
SEE MORE QUESTIONS
arrow_forward_ios
Recommended textbooks for you
- A First Course in Probability (10th Edition)ProbabilityISBN:9780134753119Author:Sheldon RossPublisher:PEARSON

A First Course in Probability (10th Edition)
Probability
ISBN:9780134753119
Author:Sheldon Ross
Publisher:PEARSON