MATLAB: An Introduction with Applications
6th Edition
ISBN: 9781119256830
Author: Amos Gilat
Publisher: John Wiley & Sons Inc
expand_more
expand_more
format_list_bulleted
Concept explainers
Topic Video
Question

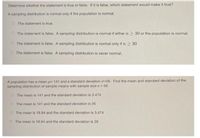
Transcribed Image Text:Determine whether the statement is true or false. If it is false, which statement would make it true?
A sampling distribution is normal only if the population is normal.
O The statement is true.
O The statement is false. A sampling distribution is normal if either n > 30 or the population is normal.
O The statement is false. A sampling distribution is normal only if n 2 30
O The statement is false. A sampling distribution is never normal.
A population has a mean u= 141 and a standard deviation a=26. Find the mean and standard deviation of the
sampling distribution of sample means with sample size n = 56.
O The mean is 141 and the standard deviation is 3.474
O The mean is 141 and the standard deviation is 26
O The mean is 18.84 and the standard deviation is 3.474
The mean is 18.84 and the standard deviation is 26

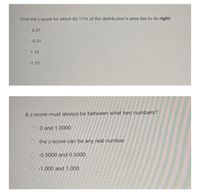
Transcribed Image Text:Find the z-score for which 62.17% of the distribution's area lies to its right.
O 0.31
-0.31
O 1.12
O -1.12
A z-score must always be between what two numbers?
O O and 1.0000
the z-score can be any real number
-0.5000 and 0.5000
-1.000 and 1.000
Expert Solution
This question has been solved!
Explore an expertly crafted, step-by-step solution for a thorough understanding of key concepts.
This is a popular solution
Trending nowThis is a popular solution!
Step by stepSolved in 3 steps

Knowledge Booster
Learn more about
Need a deep-dive on the concept behind this application? Look no further. Learn more about this topic, statistics and related others by exploring similar questions and additional content below.Similar questions
- Directions: Identify which type of sampling is used: random, stratified random, cluster, systematic, or convenience. _____________________1. A psychologist selects 5 boys and 5 girls from each of Special Science classes. _____________________2. When he made an important announcement, he based conclusion on 5,000 responses from 50,000 questionnaires to students. _____________________3. The game show organizer writes the name of each contestant on a separate card, shuffles the cards, and draws 6 names. _____________________4. Globe selects every 50th cellphone from the assembly line an conduct a thorough test of quality.arrow_forwardQuestion Help Describe the sampling distribution of p. Assume the size of the population is 30,000. n= 600, p 0.3 Choose the phrase that best describes the shape of the sampling distribution of p below. O A. Approximately normal because ns0.05N and np(1-p) 2 10. O B. Not normal because n s0.05N and np(1 - p) < 10. O C. Not normal because n s0.05N and np(1-p) 2 10. O D. Approximately normal because ns0.05N and np(1- p) < 10. Determine the mean of the sampling distribution of p. (Round to one decimal place as needed.) Determine the standard deviation of the sampling distribution of p. (Round to three decimal places as needed.) sS Click to select your answer(s). mentary Statistics Section OL1 Spring 2021 CO) is based on Sullivan: Fundamentals of Statistics, 5e rivacy Policy | Copyright © 2021 Pearson Education Inc. All Rights Reserved.arrow_forward15-arrow_forward
- Which of the following is an example of a discrete random variable? Group of answer choices The number of horses owned by a farmer The length of a window frame The distance from home to work for a worker The weight of a box of cookiesarrow_forwardP₁ and John has a coin with xercise Susan has a coin with P(head) P (head) = P₂. Susan tosses her coin m times. Each time she obtains heads, John tosses his coin (otherwise not). Find the distribution of the total number of heads obtained by John.arrow_forwardSampling distribution of x-bar is the? mean of the sample. probability distribution of the sample proportion. probability distribution of the sample mean. mean of the population.arrow_forward
- Degrees of Freedom Five pulse rates randomly selected from Data Set 1 “Body Data” in Appendix B have a mean of 78.0 beats per minute. Four of the pulse rates are 82, 78, 56, and 84. a. Find the missing value. b. We need to create a list of n values that have a specific known mean. We are free to select any values we desire for some of the n values. How many of the values can be freely assigned before the remaining values are determined? (The result is referred to as the number of degrees of freedom.)arrow_forwardConstruct a probability distribution ofr the dataarrow_forwardThe probability distribution shown here describes a population of measurements that can assume values of 1, 3, 5, and 7, each of which occurs with the same relative frequency. 1 p(x) 4 4 4 a. Calculate the mean of all the different samples of n = 2 measurements that can be selected from this population. Select the correct choice below and fill in the answer boxes within your choice. A. Sample 1,3 1,5 1,7 3,1 3,5 3,7 5,1 5,3 5,7 7,1 7,3 7,5 х B. Sample 1,1 1,3 1,5 1,7 3,1 3,3 3,5 3,7 х Sample 5,1 5,3 5,5 5,7 7,1 7,3 7,5 7,7 х C. Sample 1,1 1,3 1,5 1,7 3,3 3,5 3,7 5,5 5,7 7,7 хarrow_forward
arrow_back_ios
SEE MORE QUESTIONS
arrow_forward_ios
Recommended textbooks for you
 MATLAB: An Introduction with ApplicationsStatisticsISBN:9781119256830Author:Amos GilatPublisher:John Wiley & Sons Inc
 Probability and Statistics for Engineering and th...StatisticsISBN:9781305251809Author:Jay L. DevorePublisher:Cengage Learning
 Statistics for The Behavioral Sciences (MindTap C...StatisticsISBN:9781305504912Author:Frederick J Gravetter, Larry B. WallnauPublisher:Cengage Learning
 Elementary Statistics: Picturing the World (7th E...StatisticsISBN:9780134683416Author:Ron Larson, Betsy FarberPublisher:PEARSON
 The Basic Practice of StatisticsStatisticsISBN:9781319042578Author:David S. Moore, William I. Notz, Michael A. FlignerPublisher:W. H. Freeman
 Introduction to the Practice of StatisticsStatisticsISBN:9781319013387Author:David S. Moore, George P. McCabe, Bruce A. CraigPublisher:W. H. Freeman

MATLAB: An Introduction with Applications
Statistics
ISBN:9781119256830
Author:Amos Gilat
Publisher:John Wiley & Sons Inc

Probability and Statistics for Engineering and th...
Statistics
ISBN:9781305251809
Author:Jay L. Devore
Publisher:Cengage Learning

Statistics for The Behavioral Sciences (MindTap C...
Statistics
ISBN:9781305504912
Author:Frederick J Gravetter, Larry B. Wallnau
Publisher:Cengage Learning

Elementary Statistics: Picturing the World (7th E...
Statistics
ISBN:9780134683416
Author:Ron Larson, Betsy Farber
Publisher:PEARSON

The Basic Practice of Statistics
Statistics
ISBN:9781319042578
Author:David S. Moore, William I. Notz, Michael A. Fligner
Publisher:W. H. Freeman

Introduction to the Practice of Statistics
Statistics
ISBN:9781319013387
Author:David S. Moore, George P. McCabe, Bruce A. Craig
Publisher:W. H. Freeman