
MATLAB: An Introduction with Applications
6th Edition
ISBN: 9781119256830
Author: Amos Gilat
Publisher: John Wiley & Sons Inc
expand_more
expand_more
format_list_bulleted
Related questions
Concept explainers
Question
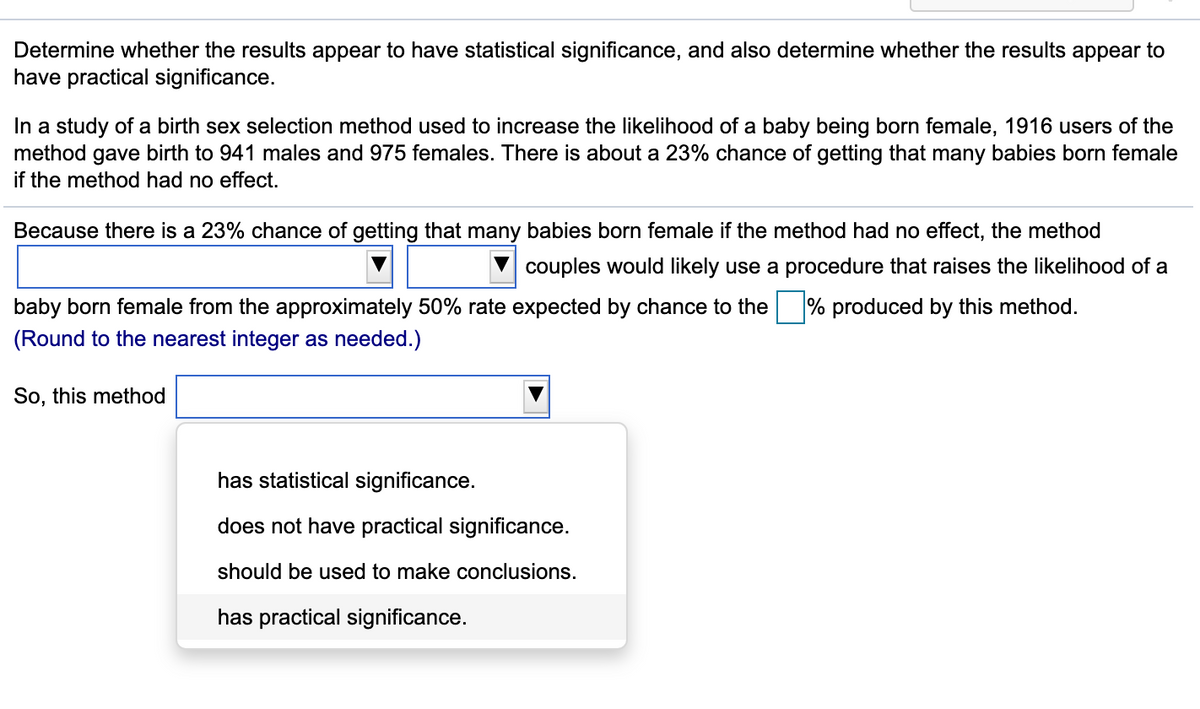

Transcribed Image Text:Determine whether the results appear to have statistical significance, and also determine whether the results appear to
have practical significance.
In a study of a birth sex selection method used to increase the likelihood of a baby being born female, 1916 users of the
method gave birth to 941 males and 975 females. There is about a 23% chance of getting that many babies born female
if the method had no effect.
Because there is a 23% chance of getting that many babies born female if the method had no effect, the method
couples would likely use a procedure that raises the likelihood of a
baby born female from the approximately 50% rate expected by chance to the % produced by this method.
(Round to the nearest integer as needed.)
So, this method
has statistical significance.
does not have practical significance.
should be used to make conclusions.
has practical significance.
Expert Solution
This question has been solved!
Explore an expertly crafted, step-by-step solution for a thorough understanding of key concepts.

This is a popular solution

Trending nowThis is a popular solution!

Step by stepSolved in 2 steps with 1 images

Knowledge Booster


Learn more about
Need a deep-dive on the concept behind this application? Look no further. Learn more about this topic, statistics and related others by exploring similar questions and additional content below.Similar questions
- A president of the teachers’ union is preparing for upcoming negotiations. He is investigating the salary structure of classroom teachers in a district. He believes there are three factors that affect a teacher’s salary: years of experience, a teaching effectiveness rating given by the principal, and whether the teacher has a master’s degree (0 = no, 1 = yes). A random sample of 20 teachers resulted in the following data. Salary Years Rating Masters 31.100 8 35 0 33.600 5 43 0 29.300 2 51 1 43.000 15 60 1 38.600 11 73 0 45.000 14 80 1 42.000 9 76 0 36.800 7 54 1 48.600 22 55 1 31.700 3 90 1 25.700 1 30 0 30.600 5 44 0 51.800 23 84 1 46.700 17 76 0 38.400 12 68 1 33.600 14 25 0 41.800 8 90 1 30.700 4 62 0 32.800 2 80 1 42.800 8 72 0 a. Determine the regression equation. What salary would you estimate for a teacher with 11…arrow_forwardThe Humane Society of California reported in one of its most recent magazines that 11.6% of American Adults have both a cat and a dog in their household. Suppose that this data is based on a 1,000 randomly selected independent American adults. Which conditions did this study meet? The data is a (choose one: random or non random) sample We know that there are at least (provide a number here) successes and at least (provide a number here) failuresarrow_forwarde-Books A study by the Pew Internet & American LifeProject found that 78% of U.S. residents over 16 yearsold read a book in the past 12 months. They also foundthat 21% had read an e-book using a reader or computer during that period. A newspaper reporting on these find-ings concluded that 99% of U.S. adult residents had reada book in some fashion in the past year. (http://libraries.pewinternet.org/2012/04/04/the-rise-of-e-reading/) Do youagree? Explain.arrow_forward
- Many fundraisers ask for donations using email and text messages. A paper describes an experiment to investigate whether the proportion of people who make a donation when asked for a donation by email is different from the proportion of people who make a donation when asked for a donation in a text message. In this experiment, 1.5% of those who received and opened an email request for a donation and 7.2% of those who received a text message asking for a donation actually made a donation. Assume that the people who received these requests were randomly assigned to one of the two groups (email or text message) and suppose that the given percentages are based on sample sizes of 2,000 (the actual sample sizes in the experiment were much larger). (Let p1 be the proportion who make a donation after receiving an email, and p2 be the proportion who make a donation after receiving a text message.)arrow_forwardDetermine whether the results appear to have statistical significance, and also determine whether the results appear to have practical significance. In a study of a birth sex selection method used to increase the likelihood of a baby being born female, 1926 users of the method gave birth to 945 males and 981 females. There is about a 21% chance of getting that many babies born female if the method had no effect. ..... Because there is a 21% chance of getting that many babies born female if the method had no effect, the method does not have practical significance. Not many couples would likely use a procedure that raises the likelihood of a baby born female from the approximately 50% rate expected by chance to the % produced by this method. (Round to the nearest integer as needed.) So, this method does not have practical significance.arrow_forwardA local school board wants to estimate the difference in the proportion of households with school-aged children that would support starting the school year a week earlier, and the proportion of households without school-aged children that would support starting the school year a week earlier. They survey a random sample of 40 households with school-aged children about whether they would support starting the school year a week earlier, and 30 households respond yes. They survey a random sample of 45 households that do not have school-aged children, and 25 respond yes. Assuming the conditions for inference have been met, what is the 90% confidence interval for the difference in proportions of households that would support starting the school year a week earlier?arrow_forward
- Determine whether the results below appear to have statistical significance, and also determine whether the results have practical significance. In a study of a weight loss program, 7 subjects lost an average of 49 lbs. It is found that there is about a 37% chance of getting such results with a diet that has no effect. Does the weight loss program have statistical significance? OA. Yes, the program is statistically significant because the results are likely to occur by chance. OB. Yes, the program is statistically significant because the results are unlikely to occur by chance. O C. No, the program is not statistically significant because the results are unlikely to occur by chance. O D. No, the program is not statistically significant because the results are likely to occur by chance. Does the weight loss program have practical significance? OA. Yes, the program is practically significant because the amount of lost weight is large enough to be considered practically significant. OB.…arrow_forwardAthabasca Fishing Lodge is located on Lake Athabasca in northern Canada. In one of its recent brochures, the lodge advertises that 75% of its guests catch northern pike over 20 pounds. Suppose that last summer 65 out of a random sample of 84 guests did, in fact, catch northern pike weighing over 20 pounds. Does this indicate that the population proportion of guests who catch pike over 20 pounds is different from 75% (either higher or lower)? Use? = 0.05 . Is the sample size large enough to approximate distribution using Normal distribution? WHY?.b. What are the hypotheses?arrow_forwardA research group conducted an extensive survey of 3044 wage and salaried workers on issues ranging from relationships with their bosses to household chores. The data were gathered through hour-long telephone interviews with a nationally representative sample. In response to the question, "What does success mean to you?" 1586 responded, "Personal satisfaction from doing a good job." Let p be the population proportion of all wage and salaried workers who would respond the same way to the stated question. Find a 90% confidence interval for p. (Round your answers to three decimal places.) lower limit upper limitarrow_forward
- A local school board wants to estimate the difference in the proportion of households with school-aged children that would support starting the school year a week earlier, and the proportion of households without school-aged children that would support starting the school year a week earlier. They survey a random sample of 40 households with school-aged children about whether they would support starting the school year a week earlier, and 38 households respond yes. They survey a random sample of 45 households that do not have school-aged children, and 25 respond yes. The school board plans to construct a 90% confidence interval for the difference in proportions of households who would support starting the school year a week earlier. Are the conditions for inference met? A) Yes, the conditions for inference are met. B) No, the 10% condition is not met. C) No, the randomness condition is not met. D) No, the Large Counts Condition is not met.arrow_forwardAn industrial psychologist feels that a big factor in job turnover among assembly-line workers is the individual employees' self-esteem. He thinks that workers who change jobs often (population A) have, on the average, lower self-esteem, as measured by standardized test, than workers who do not (population B). To determine whether he can support his belief with statistical analysis, he draws a simple random sample of employees from each population and gives a test measuring self-esteem. The results are as follows. At 0.05 level of significance and assuming equal variances. Mean Standard Deviation Sample size A 52.3 9.23 10 69.47 11.78 17 Provide the tabular and computed value of the test statistic. O a. 1.703; 3.05 O b. 2.06; 3.94 O . 1.708; 4.01 O d. 2.052; 3.46arrow_forwardWhen we test the hypothesis that the population proportions are equal, we can use the Z test for a one-sided as well as a two-sided alternative. Select one: a. False b. True C. Not surearrow_forward
arrow_back_ios
SEE MORE QUESTIONS
arrow_forward_ios
Recommended textbooks for you
- MATLAB: An Introduction with ApplicationsStatisticsISBN:9781119256830Author:Amos GilatPublisher:John Wiley & Sons Inc
 Probability and Statistics for Engineering and th...StatisticsISBN:9781305251809Author:Jay L. DevorePublisher:Cengage Learning
 Statistics for The Behavioral Sciences (MindTap C...StatisticsISBN:9781305504912Author:Frederick J Gravetter, Larry B. WallnauPublisher:Cengage Learning
  Elementary Statistics: Picturing the World (7th E...StatisticsISBN:9780134683416Author:Ron Larson, Betsy FarberPublisher:PEARSON
 The Basic Practice of StatisticsStatisticsISBN:9781319042578Author:David S. Moore, William I. Notz, Michael A. FlignerPublisher:W. H. Freeman
 Introduction to the Practice of StatisticsStatisticsISBN:9781319013387Author:David S. Moore, George P. McCabe, Bruce A. CraigPublisher:W. H. Freeman
MATLAB: An Introduction with Applications
Statistics
ISBN:9781119256830
Author:Amos Gilat
Publisher:John Wiley & Sons Inc
Probability and Statistics for Engineering and th...
Statistics
ISBN:9781305251809
Author:Jay L. Devore
Publisher:Cengage Learning
Statistics for The Behavioral Sciences (MindTap C...
Statistics
ISBN:9781305504912
Author:Frederick J Gravetter, Larry B. Wallnau
Publisher:Cengage Learning
Elementary Statistics: Picturing the World (7th E...
Statistics
ISBN:9780134683416
Author:Ron Larson, Betsy Farber
Publisher:PEARSON
The Basic Practice of Statistics
Statistics
ISBN:9781319042578
Author:David S. Moore, William I. Notz, Michael A. Fligner
Publisher:W. H. Freeman
Introduction to the Practice of Statistics
Statistics
ISBN:9781319013387
Author:David S. Moore, George P. McCabe, Bruce A. Craig
Publisher:W. H. Freeman