
MATLAB: An Introduction with Applications
6th Edition
ISBN: 9781119256830
Author: Amos Gilat
Publisher: John Wiley & Sons Inc
expand_more
expand_more
format_list_bulleted
Related questions
Question
Determine the exponential regression of the data below using either a calculator or spreadsheet program. Then, estimate the x value when the y value is 5.2. Round your answer to one decimal place.
(−4.7,10.7),(−7.8,20.6),(−10.5,30.2),(−15.6,41),(−20.8,56.1),(−22,65.1)
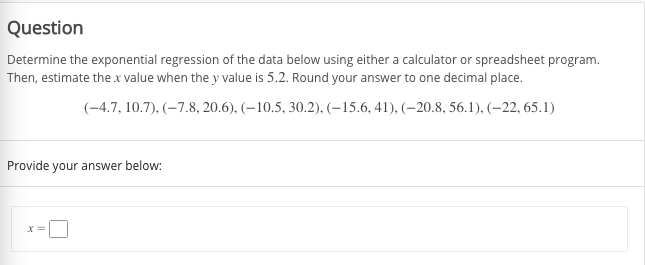

Transcribed Image Text:Question
Determine the exponential regression of the data below using either a calculator or spreadsheet program.
Then, estimate thex value when the y value is 5.2. Round your answer to one decimal place.
(-4.7, 10.7), (-7.8, 20.6), (–10.5, 30.2). (–15.6, 41), (–20.8, 56.1), (–22, 65.1)
Provide your answer below:
X=
Expert Solution
This question has been solved!
Explore an expertly crafted, step-by-step solution for a thorough understanding of key concepts.

This is a popular solution

Trending nowThis is a popular solution!

Step by stepSolved in 2 steps with 1 images

Knowledge Booster

Similar questions
- In regression analysis, the coefficient of determination R2 measures the amount of variation in y that is:arrow_forwardWhere y= -0.00630x + 41.1 A certain gas-powered car weighs 3685pounds and gets 16 miles per gallon. Is the miles per gallon on average, or below a average for care this weight? What is estimated average miles per gallon for care this weight? What is the miles per gallon of this car is below or above average?arrow_forwardCity One has 205 rainy days out of 365 days while City Two has 168 rainy days out of 365 days. Test if the percentage of rainy days in City One is larger than the percentage of rainy days in City Two. Use α=0.05. Round you answer to 3 decimal places.arrow_forward
- The percent of high school students who smoked cigarettes on 1 or more of the 30 days preceding the survey is given by y = -0.064x² +0.277x +33.715, where x is the number of years after 1990. During what years from 1990 on is the percent greater than 30%? From to the percent is greater than 30%. (Round up to the nearest year as needed.)arrow_forwardThe exposure index If tor 4.35 milieter camera is a mensurernent of the amount. of light nat his the firm. I Is determined by the equation, ET - 1o% ( 4), where fie the -7-stop? seting on the camera, and t is the exposure time in seconds. Suppose the t. stop setting is 16 and the desired exposure time is 2 seconds. What wil the the resulting exposure index begarrow_forwardto the right of z= -2.17arrow_forward
- A trendline is given to depict enrollment at a local college where x is the year and y represents enrollment. Y=178.09x-353194 Use the rrendline ro estimate the enrollment for 2009. Round to the nearest whole number.arrow_forwardCarol is studying the aggresive behavior in children and how often they watch TV shows about helping others. She calculated that r = -2.9. Which of the following would be most accurate. A.the relationship is negative. B. none of the above. C. the relationship is strong and negative. D. the relationship is weak and negative.arrow_forward
arrow_back_ios
arrow_forward_ios
Recommended textbooks for you
- MATLAB: An Introduction with ApplicationsStatisticsISBN:9781119256830Author:Amos GilatPublisher:John Wiley & Sons Inc
 Probability and Statistics for Engineering and th...StatisticsISBN:9781305251809Author:Jay L. DevorePublisher:Cengage Learning
 Statistics for The Behavioral Sciences (MindTap C...StatisticsISBN:9781305504912Author:Frederick J Gravetter, Larry B. WallnauPublisher:Cengage Learning
  Elementary Statistics: Picturing the World (7th E...StatisticsISBN:9780134683416Author:Ron Larson, Betsy FarberPublisher:PEARSON
 The Basic Practice of StatisticsStatisticsISBN:9781319042578Author:David S. Moore, William I. Notz, Michael A. FlignerPublisher:W. H. Freeman
 Introduction to the Practice of StatisticsStatisticsISBN:9781319013387Author:David S. Moore, George P. McCabe, Bruce A. CraigPublisher:W. H. Freeman
MATLAB: An Introduction with Applications
Statistics
ISBN:9781119256830
Author:Amos Gilat
Publisher:John Wiley & Sons Inc
Probability and Statistics for Engineering and th...
Statistics
ISBN:9781305251809
Author:Jay L. Devore
Publisher:Cengage Learning
Statistics for The Behavioral Sciences (MindTap C...
Statistics
ISBN:9781305504912
Author:Frederick J Gravetter, Larry B. Wallnau
Publisher:Cengage Learning
Elementary Statistics: Picturing the World (7th E...
Statistics
ISBN:9780134683416
Author:Ron Larson, Betsy Farber
Publisher:PEARSON
The Basic Practice of Statistics
Statistics
ISBN:9781319042578
Author:David S. Moore, William I. Notz, Michael A. Fligner
Publisher:W. H. Freeman
Introduction to the Practice of Statistics
Statistics
ISBN:9781319013387
Author:David S. Moore, George P. McCabe, Bruce A. Craig
Publisher:W. H. Freeman