
MATLAB: An Introduction with Applications
6th Edition
ISBN: 9781119256830
Author: Amos Gilat
Publisher: John Wiley & Sons Inc
expand_more
expand_more
format_list_bulleted
Related questions
Question
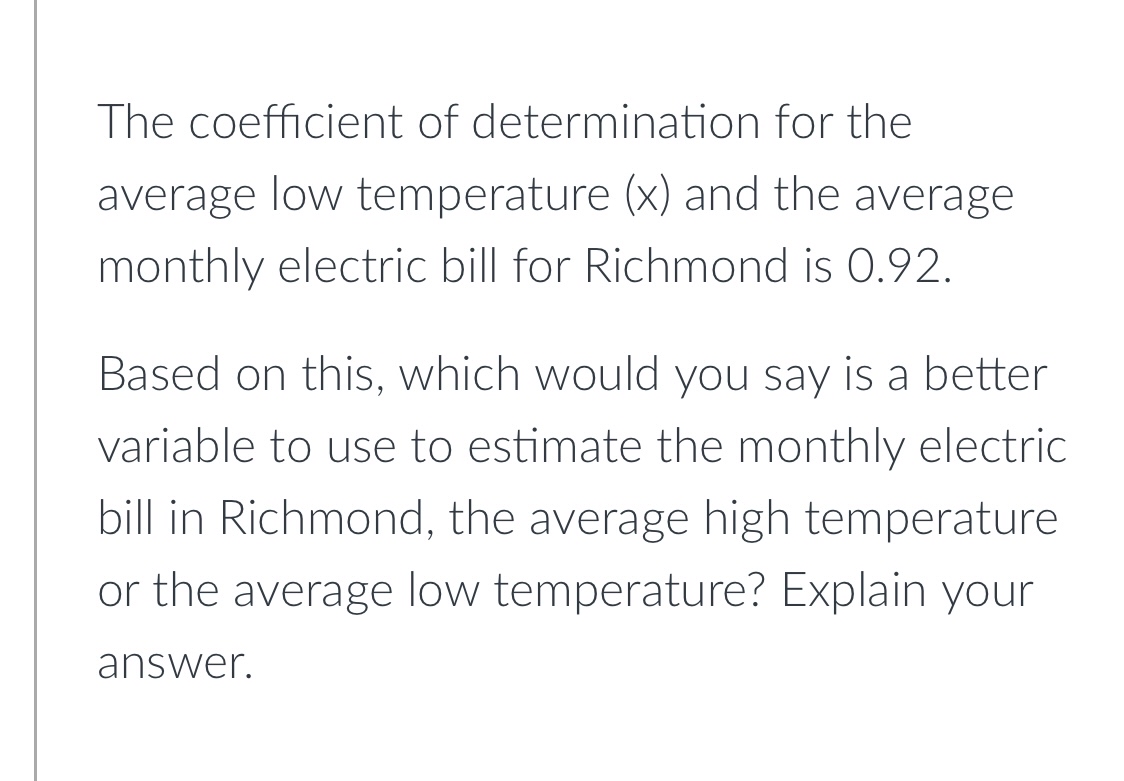

Transcribed Image Text:The coefficient of determination for the
average low temperature (x) and the average
monthly electric bill for Richmond is 0.92.
Based on this, which would you say is a better
variable to use to estimate the monthly electric
bill in Richmond, the average high temperature
or the average low temperature? Explain your
answer.
Expert Solution
arrow_forward
Step 1
Given:
Coefficient of determination

Trending nowThis is a popular solution!

Step by stepSolved in 2 steps

Knowledge Booster

Similar questions
- KNOW HOW TO DO PERCENT ERROR EQUATION?arrow_forwardThe z-score for an IQ of 104 is 0.75.Using the answer from Step 1, find the percent of the patients with IQs above 104. (Round your answer to one decimal place.)arrow_forwardTwo companies report a 15% gain in online sales over the last year. Suppose Company Q had 25 online sales and Company Z had 150 online sales last year. Sam says that they have the same growth while Anna says that they do not. Who is correct? Justify your answer using absolute change and percent change.arrow_forward
- The cost of fuel is the largest component of cost of ownership for most vehicles. Fuel cost is (almost) inversely proportional to gas mileage; higher gas mileage means lower fuel cost and vice-versa. If you keep track of the number of miles driven on each tank of gas as well as how much gas is purchased, it is easy to calculate gas mileage; many cell phone apps exist to track this. The data in the following table is the gas mileage for Mr. Hebert's 2015 Jeep Wrangler Unlimited. 12.85 14.98 15.36 17.09 18.86 13.28 15.11 15.62 17.50 19.07 13.48 15.12 15.65 17.66 20.91 14.65 15.13 16.41 18.17 21.17 14.71 15.14 16.80 18.27 22.11 e. Does this data show any skew or symmetry? A. Left - Skewed B. Right - Skewed C. Symmetricalarrow_forwardA pediatrician wants to determine the relation that exists between a child's height (x) and head circumference (y). She randomly selects 11 children from her practice and measures their height and head circumference in inches. She finds that the correlation is 0.477 and the regression equation is y = 0.149x + 8.15 What proportion of the variation in head circumference can be explained by the variation in the values of height? % Report answer as a percentage accurate to one decimal place.arrow_forwardHere are two sets of bivariate data with the same response variable. The first contains the variables x & y. The second contains the variables w & y | y w y 25.3 43.9 68.8 36.7 43.8 56.7 57 55 49.2 61.3 27.9 52 57.4 69.3 48 | 50.5 33.7 47.3 58.3 49.2 46.3 56 46.6 34.4 67.1 75.8 35.1 48.3 25.7 43.4 19 76.8 47.2 57.9 7.3 56.8 37.5 57.4 32.9 56.2 44.8 60.4 43.8 49 29.7 38.5 26.4 | 60.9 42.8 53.6 55.6 49.4 60.3 69.7 53.9 55 53.2 67.1 47.8 42.7 57.4 66.3 25 54.8 45.5 57.6 13.9 65 42 51.6 69.5 43.6 38.9 54.8 79.5 29arrow_forward
- The cost of fuel is the largest component of cost of ownership for most vehicles. Fuel cost is (almost) inversely proportional to gas mileage; higher gas mileage means lower fuel cost and vice-versa. If you keep track of the number of miles driven on each tank of gas as well as how much gas is purchased, it is easy to calculate gas mileage; many cell phone apps exist to track this. The data in the following table is the gas mileage for Mr. Hebert's 2015 Jeep Wrangler Unlimited. 12.85 14.98 15.36 17.09 18.86 13.28 15.11 15.62 17.50 19.07 13.48 15.12 15.65 17.66 20.91 14.65 15.13 16.41 18.17 21.17 14.71 15.14 16.80 18.27 22.11 f. Construct a 95% confidence interval to estimate the average fuel economy of the jeep. enter your response here≤μ≤enter your response here (Round your answers to 2 decimal places.)arrow_forwardCity One has 205 rainy days out of 365 days while City Two has 168 rainy days out of 365 days. Test if the percentage of rainy days in City One is larger than the percentage of rainy days in City Two. Use α=0.05. Round you answer to 3 decimal places.arrow_forwardThe z-score for 13.5 ounces is -2.50; the z-score for 15.5 ounces is 2.50. Using the answers from Step 1, what percent of the boxes will weigh between 13.5 ounces and 15.5 ounces? (Round your answer to one decimal place.)arrow_forward
- A pediatrician wants to determine the relation that exists between a child's height (x) and head circumference (y). She randomly selects 11 children from her practice and measures their height and head circumference in inches. She finds that the correlation is 0.694, and the regression equation is y = 0.294x + 2.02. What proportion of the variation in head circumference can be explained by the variation in the values of height? Round your answer to three decimal places. %arrow_forwardThe following data was collected to explore how the number of square feet in a house, the number of bedrooms, and the age of the house affect the selling price of the house. The dependent variable is the selling price of the house, the first independent variable (x1�1) is the square footage, the second independent variable (x2�2) is the number of bedrooms, and the third independent variable (x3�3) is the age of the house. Effects on Selling Price of Houses Square Feet Number of Bedrooms Age Selling Price 11191119 33 33 100900100900 13081308 33 44 119800119800 14521452 33 66 189800189800 16931693 33 66 190500190500 20052005 33 66 196900196900 22102210 33 99 216600216600 23012301 44 99 250900250900 23452345 44 1010 267800267800 28532853 55 1313 270000270000 Copy Data Step 1 of 2 : Find the p-value for the regression equation that fits the given data. Round your answer to four decimal placesarrow_forwardGive an example of a nominal variable for people in recovery for substance abusearrow_forward
arrow_back_ios
SEE MORE QUESTIONS
arrow_forward_ios
Recommended textbooks for you
- MATLAB: An Introduction with ApplicationsStatisticsISBN:9781119256830Author:Amos GilatPublisher:John Wiley & Sons Inc
 Probability and Statistics for Engineering and th...StatisticsISBN:9781305251809Author:Jay L. DevorePublisher:Cengage Learning
 Statistics for The Behavioral Sciences (MindTap C...StatisticsISBN:9781305504912Author:Frederick J Gravetter, Larry B. WallnauPublisher:Cengage Learning
  Elementary Statistics: Picturing the World (7th E...StatisticsISBN:9780134683416Author:Ron Larson, Betsy FarberPublisher:PEARSON
 The Basic Practice of StatisticsStatisticsISBN:9781319042578Author:David S. Moore, William I. Notz, Michael A. FlignerPublisher:W. H. Freeman
 Introduction to the Practice of StatisticsStatisticsISBN:9781319013387Author:David S. Moore, George P. McCabe, Bruce A. CraigPublisher:W. H. Freeman
MATLAB: An Introduction with Applications
Statistics
ISBN:9781119256830
Author:Amos Gilat
Publisher:John Wiley & Sons Inc
Probability and Statistics for Engineering and th...
Statistics
ISBN:9781305251809
Author:Jay L. Devore
Publisher:Cengage Learning
Statistics for The Behavioral Sciences (MindTap C...
Statistics
ISBN:9781305504912
Author:Frederick J Gravetter, Larry B. Wallnau
Publisher:Cengage Learning
Elementary Statistics: Picturing the World (7th E...
Statistics
ISBN:9780134683416
Author:Ron Larson, Betsy Farber
Publisher:PEARSON
The Basic Practice of Statistics
Statistics
ISBN:9781319042578
Author:David S. Moore, William I. Notz, Michael A. Fligner
Publisher:W. H. Freeman
Introduction to the Practice of Statistics
Statistics
ISBN:9781319013387
Author:David S. Moore, George P. McCabe, Bruce A. Craig
Publisher:W. H. Freeman