
Glencoe Algebra 1, Student Edition, 9780079039897, 0079039898, 2018
18th Edition
ISBN: 9780079039897
Author: Carter
Publisher: McGraw Hill
expand_more
expand_more
format_list_bulleted
Related questions
Question

Transcribed Image Text:Describing TheData
Format Tools
Tools Extensions
+
Extensions Help
00% ▼ Normal text ▾ | Arial
1
|- 9 +
BIUA
©
1
13
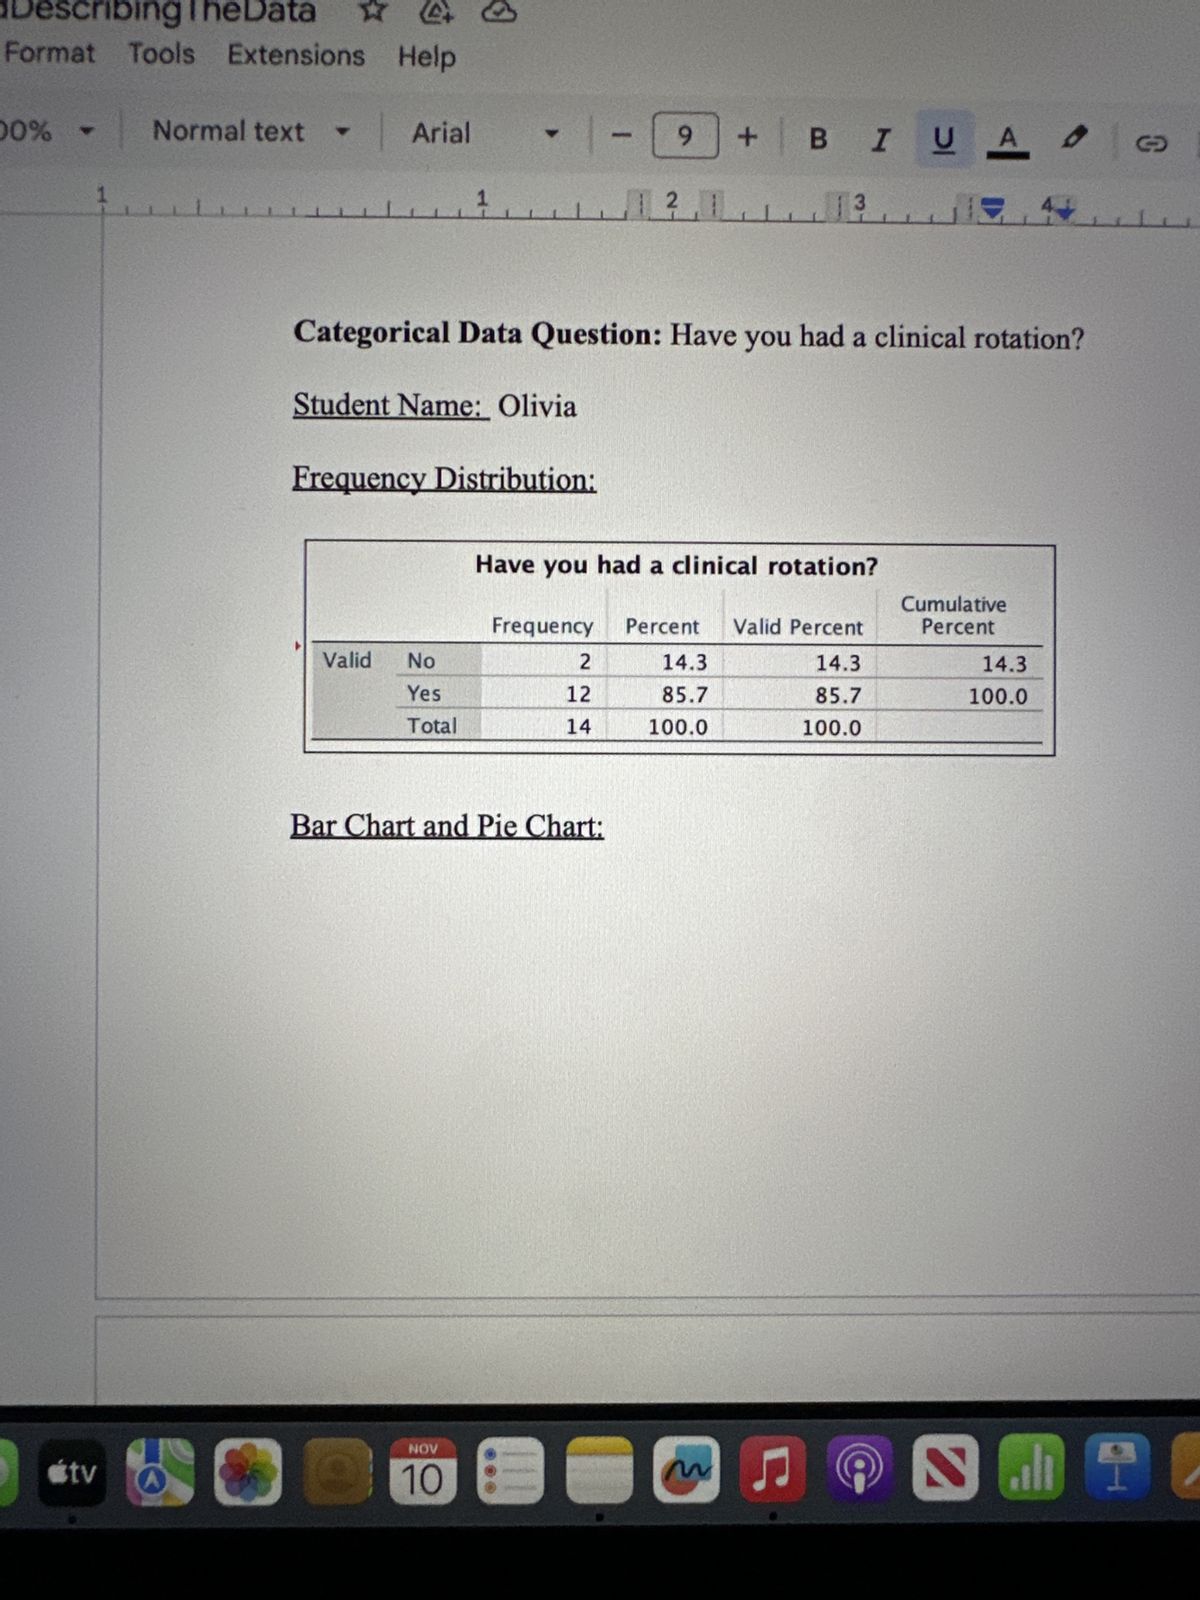
Categorical Data Question: Have you had a clinical rotation?
Student Name: Olivia
Frequency Distribution:
Have you had a clinical rotation?
Frequency
Percent
Valid
No
2
14.3
Valid Percent
14.3
Cumulative
Percent
14.3
Yes
12
85.7
85.7
100.0
Total
14
100.0
100.0
Bar Chart and Pie Chart:
Étv
O
NOV
10
M
Ը
SAVE
AI-Generated Solution
info
AI-generated content may present inaccurate or offensive content that does not represent bartleby’s views.
Unlock instant AI solutions
Tap the button
to generate a solution
to generate a solution
Click the button to generate
a solution
a solution
Knowledge Booster

Similar questions
- Can you guys help me with this homework? Thank you!arrow_forwardWhat is the interquartile range of the data set below? 3, 5, 6, 6, 7, 8, 9arrow_forwardUsing excel the median is 16.70 but when I calculate it manually it comes to 13.9. Why is excel wrong? A magazine's list of the world's most admired companies for 2014 is provided in the data below. The data in the column labeled "Return" shows the one-year total return (%) for the top ranked 50 companies. For the same time period the S&P average return was 18.4%. Rank CompanyName Return(%) 1 Company A 13.8 2 Company B 28.8 3 Company C 48.3 4 Company D 10.7 5 Company E 27.1 6 Company F 2.4 7 Company G 33.8 8 Company H 23.4 9 Company I 83.5 10 Company J 12.3 11 Company K 40.6 12 Company L 7.1 13 Company M 31.8 14 Company N 15.1 15 Company O 4.1 16 Company P −12.4 17 Company Q 4.8 18 Company R −14.9 19 Company S 19.5 20 Company T 14 21 Company U −11.9 22 Company V 1.8 23 Company W 27.3 24 Company X 35.2 25 Company Y 30.3 Rank CompanyName Return(%) 26 Company Z 63.2 27 Company AA 2.5 28 Company BB 6.5 29…arrow_forward
- Compare the effect of sample size versus population size on sample mean distribution. Explain sample size and population size in reference to statistics. Compare how sample size and population size effect sample mean distribution. Provide evidence and examples to support.arrow_forwardA mother is creating the family budget for next year and wants to come up with a single value to estimate the cost of the water bill every month based on the total from last year divided by 12 months. Which descriptive statistic should she use? Mode Mean Median Rangearrow_forwardExplain the meaning of the specified term Population distributionarrow_forward
- Identify the mean, median and mode based from the data below. Please show complete solutions and complete answers in a bond paper. Please take clear pictures and encircle your final answer. Submit it in pdf/jpeg/jpg/png/word file. Answers in 1 decimal place. Table 9-3 Serum Levels of Total Cholesterol Reported in 71 Participants* Cholesterol Value (mg/dL) Cholesterol Value (mg/dL) 124 128 132 133 136 138 139 146 147 149 151 153 158. 160 161 162 163 No. Observations 1 1 1 1 164 165 166 169 171 175 177 178 179 180 181 184 186 188 191 192 194 No. Observations 3 1 2 1 Cholesterol Value (mg/dL) 196 197 206 208. 209 213 217 220 221 222 226 227 228 241 264 No. Observations 2 2arrow_forwardIdentify statistics idenrify parrow_forwardThe price per share of stock for a sample of companies was recorded at the beginning of the first financial quarter and then again at the end of the first financial quarter. How stocks perform during the first quarter is an indicator of what is ahead for the stock market and the economy. Use the sample data in the file StockQuarter to answer the following. Click on the datafile logo to reference the data. Beginning of 1st end of 1stCompany Quarter QuarterBank of New York Mellon 53.82 54.19 Kraft Foods 77.02 55.70 E.I. du Pont de Nemours and Company 109.00 102.57 Consolidated Edison 83.58 79.95 Johnson & Johnson 139.23 126.01 Union Pacific…arrow_forward
- What is the value of the appropriate measure of center? What is the value of the appropriate measure of center? Mean = 95 Median = 95 Mean = 48 Median = 45.5 Mean = 102.5 Median = 102.5arrow_forwardPlease helparrow_forwardWhat is the easiest way to learn to remember the definitions Statistics Sample population Data perimeterarrow_forward
arrow_back_ios
SEE MORE QUESTIONS
arrow_forward_ios
Recommended textbooks for you
- Glencoe Algebra 1, Student Edition, 9780079039897...AlgebraISBN:9780079039897Author:CarterPublisher:McGraw Hill
 Holt Mcdougal Larson Pre-algebra: Student Edition...AlgebraISBN:9780547587776Author:HOLT MCDOUGALPublisher:HOLT MCDOUGAL
Glencoe Algebra 1, Student Edition, 9780079039897...
Algebra
ISBN:9780079039897
Author:Carter
Publisher:McGraw Hill
Holt Mcdougal Larson Pre-algebra: Student Edition...
Algebra
ISBN:9780547587776
Author:HOLT MCDOUGAL
Publisher:HOLT MCDOUGAL