MATLAB: An Introduction with Applications
6th Edition
ISBN: 9781119256830
Author: Amos Gilat
Publisher: John Wiley & Sons Inc
expand_more
expand_more
format_list_bulleted
Question
thumb_up100%
Depression scores (assessed using a likert scale) is an example of a variable measured on the:
1. Nominal scale
2. Ratio scale
3. Ordinal scale
4. Interval scale
Which is correct?

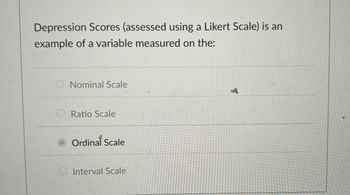
Transcribed Image Text:Depression Scores (assessed using a Likert Scale) is an
example of a variable measured on the:
Nominal Scale
Ratio Scale
Ordinal Scale
Interval Scale

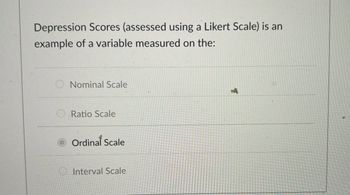
Transcribed Image Text:Depression Scores (assessed using a Likert Scale) is an
example of a variable measured on the:
Nominal Scale
Ratio Scale
Ordinal Scale
Interval Scale
Expert Solution
This question has been solved!
Explore an expertly crafted, step-by-step solution for a thorough understanding of key concepts.
Step by stepSolved in 2 steps

Knowledge Booster
Similar questions
- What is true about the range? a. All values are used in its calculation. b. Only two values are used in its calculation. c. It can be used for nominal data. d. It is in different units than the mean.arrow_forwardMatch the coefficient of determination to the scatter diagram. The scales on the x-axis and y-axis are the same for each scatter diagram. (a) R? = 0.12, (b) R2 = 0.98, (c) R? = 0.58 (a) Scatter diagram Eplantory (b) Scatter diagram (e) Scatter diagram Esplanatory II Eplanatoryarrow_forwardPlease sovle it and please do not use excel. Use just hand. I appreciate that.arrow_forward
- What is: Lower bound Upper bound Suppose a child has a height of 26.5 inches. What would be a good guess for the child's head circumference?arrow_forwardThe questions below explore ways that different institutions calculate grade point average. Part A: Some colleges use a grading scale that includes grades with a plus or minus. One such example is shown in the table below. Grade A A- B+ B B- C+ C C- D+ D D- F Point-Value 4 3.7 3.3 3 2.7 2.3 2 1.7 1.3 1 0.7 0 Suppose your grades for this term are shown in the table below. Compute your semester GPA using a weighted average. Round to the nearest hundredth. Course Grade Grade Point-Value Credits Point-Value x Credits Quantitative Reasoning B 3 College Writing C+ 3 Geology A- 5 Financial Accounting B+ 4 GPA = Part B: Suppose your college uses a grading scale that does not differentiate letter grades with a plus or minus. Therefore, the scale is as follows: Grade Point-Value A 4 B 3 C 2 D 1 F 0 Suppose your grades for this term are shown in the table below. Compute your semester GPA using a weighted average. Round to the nearest hundredth. Course Grade Grade…arrow_forwardSubject : Basic Statistics 6. I've posted an image of the question. Thank you.arrow_forward
- Write the level of measurement (nominal, interval, ordinal, ratio) and type of data for each of the following: Level of Measurement Type of data: Qualitative Quantitative Discrete Quantitative Continuous Temperature (in degrees Fahrenheit) Jersey numbers of soccer players The weight of a chemical compound used in an experiment that is obtained using a well-adjusted scale An identification of police officers by rank College entrance exam scores, such as SAT scoresarrow_forwardHemangarrow_forwardyour car is more crowded than you think. table 5.8 reports results from a 1969 personal transportation survey on "home-to-work" trips in metropolitan areas. The survey stated that the average car occupancy was 1.4 people. check that calculation.arrow_forward
arrow_back_ios
arrow_forward_ios
Recommended textbooks for you
 MATLAB: An Introduction with ApplicationsStatisticsISBN:9781119256830Author:Amos GilatPublisher:John Wiley & Sons Inc
 Probability and Statistics for Engineering and th...StatisticsISBN:9781305251809Author:Jay L. DevorePublisher:Cengage Learning
 Statistics for The Behavioral Sciences (MindTap C...StatisticsISBN:9781305504912Author:Frederick J Gravetter, Larry B. WallnauPublisher:Cengage Learning
 Elementary Statistics: Picturing the World (7th E...StatisticsISBN:9780134683416Author:Ron Larson, Betsy FarberPublisher:PEARSON
 The Basic Practice of StatisticsStatisticsISBN:9781319042578Author:David S. Moore, William I. Notz, Michael A. FlignerPublisher:W. H. Freeman
 Introduction to the Practice of StatisticsStatisticsISBN:9781319013387Author:David S. Moore, George P. McCabe, Bruce A. CraigPublisher:W. H. Freeman

MATLAB: An Introduction with Applications
Statistics
ISBN:9781119256830
Author:Amos Gilat
Publisher:John Wiley & Sons Inc

Probability and Statistics for Engineering and th...
Statistics
ISBN:9781305251809
Author:Jay L. Devore
Publisher:Cengage Learning

Statistics for The Behavioral Sciences (MindTap C...
Statistics
ISBN:9781305504912
Author:Frederick J Gravetter, Larry B. Wallnau
Publisher:Cengage Learning

Elementary Statistics: Picturing the World (7th E...
Statistics
ISBN:9780134683416
Author:Ron Larson, Betsy Farber
Publisher:PEARSON

The Basic Practice of Statistics
Statistics
ISBN:9781319042578
Author:David S. Moore, William I. Notz, Michael A. Fligner
Publisher:W. H. Freeman

Introduction to the Practice of Statistics
Statistics
ISBN:9781319013387
Author:David S. Moore, George P. McCabe, Bruce A. Craig
Publisher:W. H. Freeman