
MATLAB: An Introduction with Applications
6th Edition
ISBN: 9781119256830
Author: Amos Gilat
Publisher: John Wiley & Sons Inc
expand_more
expand_more
format_list_bulleted
Related questions
Topic Video
Question
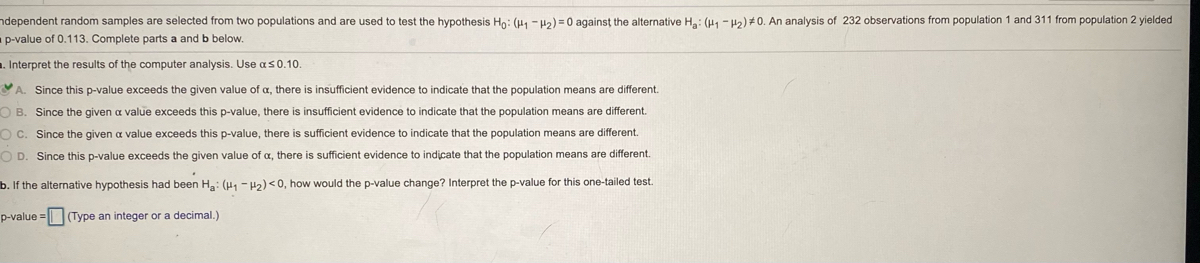

Transcribed Image Text:ndependent random samples are selected from two populations and are used to test the hypothesis Hn: (H, - H2) = 0 against the alternative H,: (4, - H2) #0. An analysis of 232 observations from population 1 and 311 from population 2 yielded
p-value of 0.113. Complete parts a and b below.
a. Interpret the results of the computer analysis. Use as0.10.
A. Since this p-value exceeds the given value of a, there is insufficient evidence to indicate that the population means are different.
O B. Since the given a value exceeds this p-value, there is insufficient evidence to indicate that the population means are different.
OC. Since the given a value exceeds this p-value, there
sufficient evidence to indicate that the population means are different.
O D. Since this p-value exceeds the given value of , there is sufficient evidence to indicate that the population means are different.
b. If the alternative hypothesis had been Ha: (H1 - H2) <0, how would the p-value change? Interpret the p-value for this one-tailed test
p-value = (Type an integer or a decimal.)
Expert Solution
This question has been solved!
Explore an expertly crafted, step-by-step solution for a thorough understanding of key concepts.

Step by stepSolved in 2 steps

Knowledge Booster


Learn more about
Need a deep-dive on the concept behind this application? Look no further. Learn more about this topic, statistics and related others by exploring similar questions and additional content below.Similar questions
- A physical therapist wanted to know whether the mean step pulse of men was less than the mean step pulse of women. She randomly selected 54 men and 70 women to participate in the study. Each subject was required to step up and down a 6-inch platform. The pulse of each subject was then recorded. The following results were obtained. Two sample T for Men vs Women N Mean StDev SE Mean Men Women 98% CI for mu Men - mu Women (- 12.20, - 1.00) T-Test mu Men = mu Women (vs H2 O C. Ho: H1 = H2; Ha: H1 #H2 (b) Identify the P-value and state the researcher's conclusion if the level of significance was a = 0.01. What is the P-value? P-value =arrow_forwardThe given quantities below were calculated from a sample data set. Στο 338 I Lu=308 Ση2 = 4678 2 y = 4236 Determine the least squares regression line. Round values to four decimal places, if necessary. Σry = 3595 n = 30 Determine the correlation coefficient. Round the solution to four decimal places, if necessary.arrow_forward4.2 A sample of 19 female bears was measured for chest girth (y) and neck girth (x), both in inches. The least squares regression equation relating the two variables is = 5.32 + 1.53 x. The standard deviation of the regression is s = 3.692. y^ 4.2.1 What is a 95% confidence interval for the average (or mean) chest girth for bears with a neck girth of 20 inches? The standard error of the fit is s.e.(fit) = 0.880 a. (27.9, 43.9) b. (28.1, 43.7) c. (34.1, 37.8) d. None of the above 4.2.2 Interpret the confidence interval obtained in 4.2.1arrow_forward
- Heights (cm) and weights (kg) are measured for 100 randomly selected adult males, and range from heights of 139 to 194 cm and weights of 39 to 150 kg. Let the predictor variable x be the first variable given. The 100 paired measurements yield x= 167.63 cm, y = 81.47 kg, r=0.106, P-value = 0.294, and y = - 108 + 1.04x. Find the best predicted value of y (weight) given an adult male who is 172 cm tall. Use a 0.05 significance level. The best predicted value of y for an adult male who is 172 cm tall is kg. (Round to two decimal places as needed.)arrow_forwardA sample of n = 20 scores is transformed in to z-scores. The mean for the 20 z-scores is ____? If a researcher reports t(18) = 1.30, p > .05 for a two-sample independent-measures experiment, the results were significant. T or F?arrow_forward116). With 77.4 and y 77.2, you You run a regression analysis on a bivariate set of data (n obtain the regression equation y -1.848z+56.533 0.092. You want to predict what value (on average) for the with a correlation coefficient of r= response variable will be obtained from a value of 180 as the explanatory variable. What is the predicted response value? %3D (Report answer accurate to one decimal place.)arrow_forward
- Heights (cm) and weights (kg) are measured for 100 randomly selected adult males, and range from heights of 133 to 188 cm and weights of 40 to 150 kg. Let the predictor variable x be the first variable given. The 100 paired measurements yield x = 167.54 cm, y = 81.35 kg, r=0.186, P-value = 0.064, and y = - 109 + 1.12x. Find the best predicted value of ŷ (weight) given an adult male who is 180 cm tall. Use a 0.10 significance level. The best predicted value of y for an adult male who is 180 cm tall is (Round to two decimal places as needed.) kg.arrow_forwardA set of n = 10 pairs of scores has ΣX = 20, ΣY = 30, and ΣXY = 74. What is the value of SP for these data?arrow_forwardHeights (cm) and weights (kg) are measured for 100 randomly selected adult males, and range from heights of 138 to 188 cm and weights of 40 to 150 kg. Let the predictor variable x be the first variable given. The 100 paired measurements yield x = 167.61 cm, y = 81.52 kg, r=0.271, P-value=0.006, and y = -103 +1.18x. Find the best predicted value of ŷ (weight) given an adult male who is 155 cm tall. Use a 0.10 significance level. The best predicted value of y for an adult male who is 155 cm tall is (Round to two decimal places as needed.) kg.arrow_forward
- Heights (cm) and weights (kg) are measured for 100 randomly selected adult males, and range from heights of 132 to 193 cm and weights of 39 to 150 kg. Let the predictor variable x be the first variable given. The 100 paired measurements yield x = 167.59 cm, y = 81.52 kg, r= 0.416, P-value = 0.000, and y = - 102 + 1.13x. Find the best predicted value of y (weight) given an adult male who is 147 cm tall. Use a 0.05 significance level. The best predicted value of y for an adult male who is 147 cm tall is kg. (Round to two decimal places as needed.)arrow_forwardHeights (cm) and weights (kg) are measured for 100 randomly selected adult males, and range from heights of 137 to 189 cm and weights of 37 to 150 kg. Let the predictor variable x be the first variable given. The 100 paired measurements yield x = 167.50 cm, y =81.41 kg, r=0.232, P-value = 0.020, and y = - 109 + 1.17x. Find the best predicted value of y (weight) given an adult male who is 145 cm tall. Use a 0.01 significance level. The best predicted value of y for an adult male who is 145 cm tall is kg. (Round to two decimal places as needed.)arrow_forwardRefer to Exercise 8.S.1. Compare the before and after populations using a t test at α = 0.05. Use a nondirectional alternative.arrow_forward
arrow_back_ios
SEE MORE QUESTIONS
arrow_forward_ios
Recommended textbooks for you
- MATLAB: An Introduction with ApplicationsStatisticsISBN:9781119256830Author:Amos GilatPublisher:John Wiley & Sons Inc
 Probability and Statistics for Engineering and th...StatisticsISBN:9781305251809Author:Jay L. DevorePublisher:Cengage Learning
 Statistics for The Behavioral Sciences (MindTap C...StatisticsISBN:9781305504912Author:Frederick J Gravetter, Larry B. WallnauPublisher:Cengage Learning
  Elementary Statistics: Picturing the World (7th E...StatisticsISBN:9780134683416Author:Ron Larson, Betsy FarberPublisher:PEARSON
 The Basic Practice of StatisticsStatisticsISBN:9781319042578Author:David S. Moore, William I. Notz, Michael A. FlignerPublisher:W. H. Freeman
 Introduction to the Practice of StatisticsStatisticsISBN:9781319013387Author:David S. Moore, George P. McCabe, Bruce A. CraigPublisher:W. H. Freeman
MATLAB: An Introduction with Applications
Statistics
ISBN:9781119256830
Author:Amos Gilat
Publisher:John Wiley & Sons Inc
Probability and Statistics for Engineering and th...
Statistics
ISBN:9781305251809
Author:Jay L. Devore
Publisher:Cengage Learning
Statistics for The Behavioral Sciences (MindTap C...
Statistics
ISBN:9781305504912
Author:Frederick J Gravetter, Larry B. Wallnau
Publisher:Cengage Learning
Elementary Statistics: Picturing the World (7th E...
Statistics
ISBN:9780134683416
Author:Ron Larson, Betsy Farber
Publisher:PEARSON
The Basic Practice of Statistics
Statistics
ISBN:9781319042578
Author:David S. Moore, William I. Notz, Michael A. Fligner
Publisher:W. H. Freeman
Introduction to the Practice of Statistics
Statistics
ISBN:9781319013387
Author:David S. Moore, George P. McCabe, Bruce A. Craig
Publisher:W. H. Freeman