
ENGR.ECONOMIC ANALYSIS
14th Edition
ISBN: 9780190931919
Author: NEWNAN
Publisher: Oxford University Press
expand_more
expand_more
format_list_bulleted
Related questions
Question
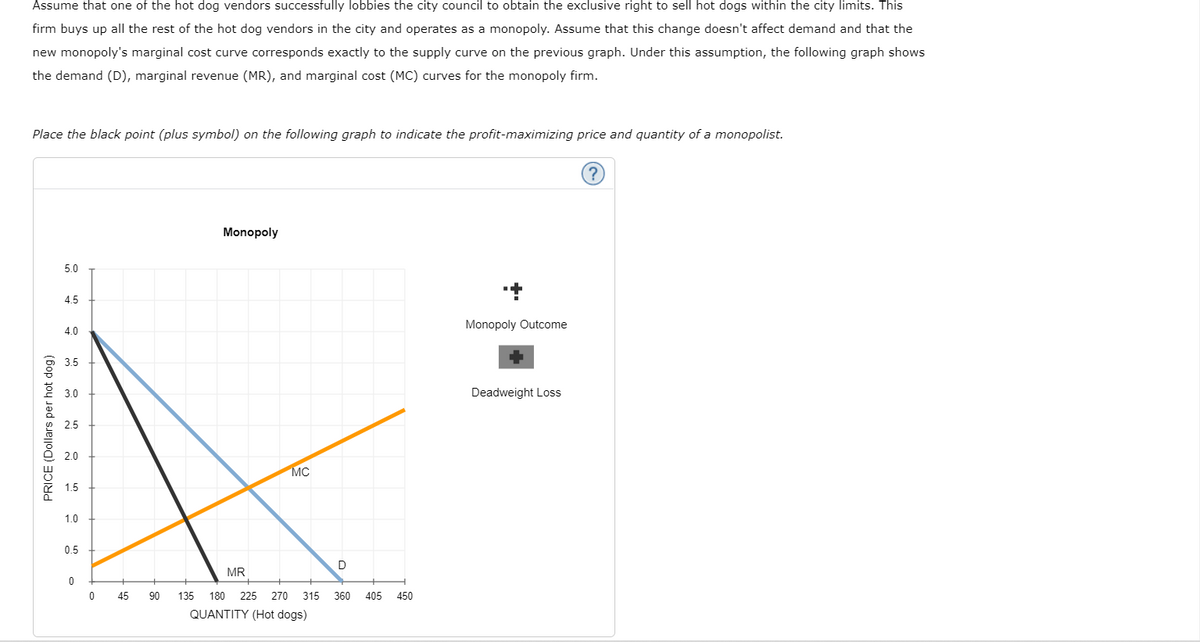

Transcribed Image Text:Assume that one of the hot dog vendors successfully lobbies the city council to obtain the exclusive right to sell hot dogs within the city limits. This
firm buys up all the rest of the hot dog vendors in the city and operates as a monopoly. Assume that this change doesn't affect demand and that the
new monopoly's marginal cost curve corresponds exactly to the supply curve on the previous graph. Under this assumption, the following graph shows
the demand (D), marginal revenue (MR), and marginal cost (MC) curves for the monopoly firm.
Place the black point (plus symbol) on the following graph to indicate the profit-maximizing price and quantity of a monopolist.
PRICE (Dollars per hot dog)
5.0
4.5
4.0
3.5
3.0
2.5
2.0
1.5
1.0
0.5
0
0
45
Monopoly
MC
MR
90 135 180 225 270 315
QUANTITY (Hot dogs)
D
360
405 450
Monopoly Outcome
Deadweight Loss
?

Transcribed Image Text:Consider the welfare effects when the industry operates under a competitive market versus a monopoly.
On the monopoly graph, use the black points (plus symbol) to shade the area that represents the loss of welfare, or deadweight loss, caused by a
monopoly. That is, show the area that was formerly part of total surplus and now does not accrue to anybody.
Deadweight loss occurs when a monopoly controls a market because the resulting equilibrium is different from the competitive outcome, which is
efficient.
In the following table, enter the price and quantity that would arise in a competitive market; then enter the profit-maximizing price and quantity that
would be chosen if a monopolist controlled this market.
Price
Market Structure (Dollars)
Competitive
Monopoly
Quantity
(Hot dogs)
Given the summary table of the two different market structures, you can infer that, in general, the price is lower under a
and the quantity is lower under a
Expert Solution
This question has been solved!
Explore an expertly crafted, step-by-step solution for a thorough understanding of key concepts.

This is a popular solution

Trending nowThis is a popular solution!

Step by stepSolved in 2 steps with 1 images

Knowledge Booster


Learn more about
Need a deep-dive on the concept behind this application? Look no further. Learn more about this topic, economics and related others by exploring similar questions and additional content below.Similar questions
- Imagine that the graph below shows a pharmaceutical firm's D, MR, and MC curves. The firm operates as a profit-maximizing monopoly. 420 400 380 360 340 320 300 280 260 240 220 200 180 160 140 120 100 80 60 40 20 0 0 50 100 MR 150 200 250 300 MC D 350 400 If the ATC is the same as the MC (there are no other costs), what is the pharmaceutical firm's total profit? -450arrow_forwardA monopoly faces the demand curve 14 P= 12-100. 13- 12 where P is measured in dollars per unit and Q in thousands of units, The monopolist has a constant average cost of $4.00 per unit 114 104 Draw the average and marginal revenue curves and the average and marginal cost curves 1) Using the line drawing tool, draw the average revenue curve and label it 'AR 2) Using the line drawing tool, draw the marginal revenue curve and label it MR'. 3.) Using the line drawing tool, draw the average cost curve and label it 'AC 4) Using the line drawing tool, draw the marginal cost curve and label t "MC 12 Carefully follow the instructions above, and only draw the required objects 6610 12 14 16 16 20 22 24 2 Quantity (thousands) What are the monopolist's profit-maximizing price and quantity? The monopoly's proft-maximizing quantity is 54 thousand units (Enter al responseo rounded to hwo decimal places.) The profit-maximizing price is s8 What is the resulting profit? Profit is 5 16 thousand. Calculate…arrow_forwardThe graph below represents sales per week of ABC Inc. Ltd, a monopoly multinational enterprise that supplies Hi-tech components. Use the graph to answer the questions that follow. "image" i. State the elasticity of the monopoly firm demand curve. ii. Considering the figure, examine the benefits of the characteristics of themonopoly demand curve to ABC Inc. Ltd. iii. Suppose the demand and cost curves result in ABC Inc. Ltd earning aneconomic profit. Do you think ABC Inc. Ltd firm will earn profit in the longrun? Explain your answer. Assume all factors constant. iv. Examine the effects of ABC Inc. Ltd on consumers.arrow_forward
- Use a diagrammatic analysis and show a monopoly that considers a couple of strategies. One is a profit maximizing strategy. The other is a revenue maximizing strategy. Which one should they opt for. Explain by being analytical. This question is asking for a graph/diagramarrow_forwardques6arrow_forwardQuestion 4 The diagram below illustrates a monopoly firm: (a) Label the curves Curve I, Curve II, Curve III, Curve IV. (b) Graphically identify profit maximizing output and price (c) Explain how the amount of profit is defined at the maximum-profit output.arrow_forward
- Explain why it is not possible for a monopoly firm to maximize its profits by charging a price in the price region where demand is inelastic, even though there are no direct substitutes for its product. Also explain how a monopoly will be able to charge a higher price than a firm producing the good under perfect, oligopolistic, or monopolistic competition?arrow_forward5arrow_forwardPrice and cost MO 120 Township is a small, isolated community served by one newspaper that can meet the market demand at a lower cost than two or more newspapers could. The Township Gazette is the only source of news. The graph shows the marginal cost of printing the Township Gazette and the market demand for it. The Township Gazette is a profit-maximizing, single-price monopoly. What is the efficient number of copies of the Township Gazette and what is the price at which the efficient number of copies could be sold? 100- The efficient number of copies of the Township Gazette is and the price at which this number could be sold is cents a copy. GALLE 80- 60- 40- 20- D 04 0 100 200 300 400 500 Quantity (newspapers per day) 600 5arrow_forward
- What is the quantity that maximizes social surplus? Explain. How much worse off is society as a result of this industry being monopolized? Show this on a graph and calculate the amount. Info needed in image belowarrow_forwardGeorge has a monopoly on burrito sales in a small town in Kansas. The burritos cost him a constant $5 each to produce. He faces following demand schedule for his product: Price Quantity Demanded $30 0 $25 1 $20 2 $15 3 $10 4 $5 5 $0 6 Under normal monopoly conditions, how many burritos should he produce, what price should he charge, and how much profit can he expect to make? Draw a graph under these assumptions showing (and calculating) producer surplus, consumer surplus, economic surplus, and deadweight loss. If George could engage in perfect price discrimination, how many burritos would he produce, what would his total revenue be, and how much profit would he earn? Draw a graph under these assumptions showing (and calculating) producer surplus, consumer surplus, economic surplus, and deadweight loss. Is society better off by allowing George to perfectly price discriminate? Defend your answer.arrow_forwardGive the perfect answer in 10 minutesread question carefullyarrow_forward
arrow_back_ios
SEE MORE QUESTIONS
arrow_forward_ios
Recommended textbooks for you
 Principles of Economics (12th Edition)EconomicsISBN:9780134078779Author:Karl E. Case, Ray C. Fair, Sharon E. OsterPublisher:PEARSON
 Engineering Economy (17th Edition)EconomicsISBN:9780134870069Author:William G. Sullivan, Elin M. Wicks, C. Patrick KoellingPublisher:PEARSON
 Principles of Economics (MindTap Course List)EconomicsISBN:9781305585126Author:N. Gregory MankiwPublisher:Cengage Learning
 Managerial Economics: A Problem Solving ApproachEconomicsISBN:9781337106665Author:Luke M. Froeb, Brian T. McCann, Michael R. Ward, Mike ShorPublisher:Cengage Learning
 Managerial Economics & Business Strategy (Mcgraw-...EconomicsISBN:9781259290619Author:Michael Baye, Jeff PrincePublisher:McGraw-Hill Education
Principles of Economics (12th Edition)
Economics
ISBN:9780134078779
Author:Karl E. Case, Ray C. Fair, Sharon E. Oster
Publisher:PEARSON
Engineering Economy (17th Edition)
Economics
ISBN:9780134870069
Author:William G. Sullivan, Elin M. Wicks, C. Patrick Koelling
Publisher:PEARSON
Principles of Economics (MindTap Course List)
Economics
ISBN:9781305585126
Author:N. Gregory Mankiw
Publisher:Cengage Learning
Managerial Economics: A Problem Solving Approach
Economics
ISBN:9781337106665
Author:Luke M. Froeb, Brian T. McCann, Michael R. Ward, Mike Shor
Publisher:Cengage Learning
Managerial Economics & Business Strategy (Mcgraw-...
Economics
ISBN:9781259290619
Author:Michael Baye, Jeff Prince
Publisher:McGraw-Hill Education