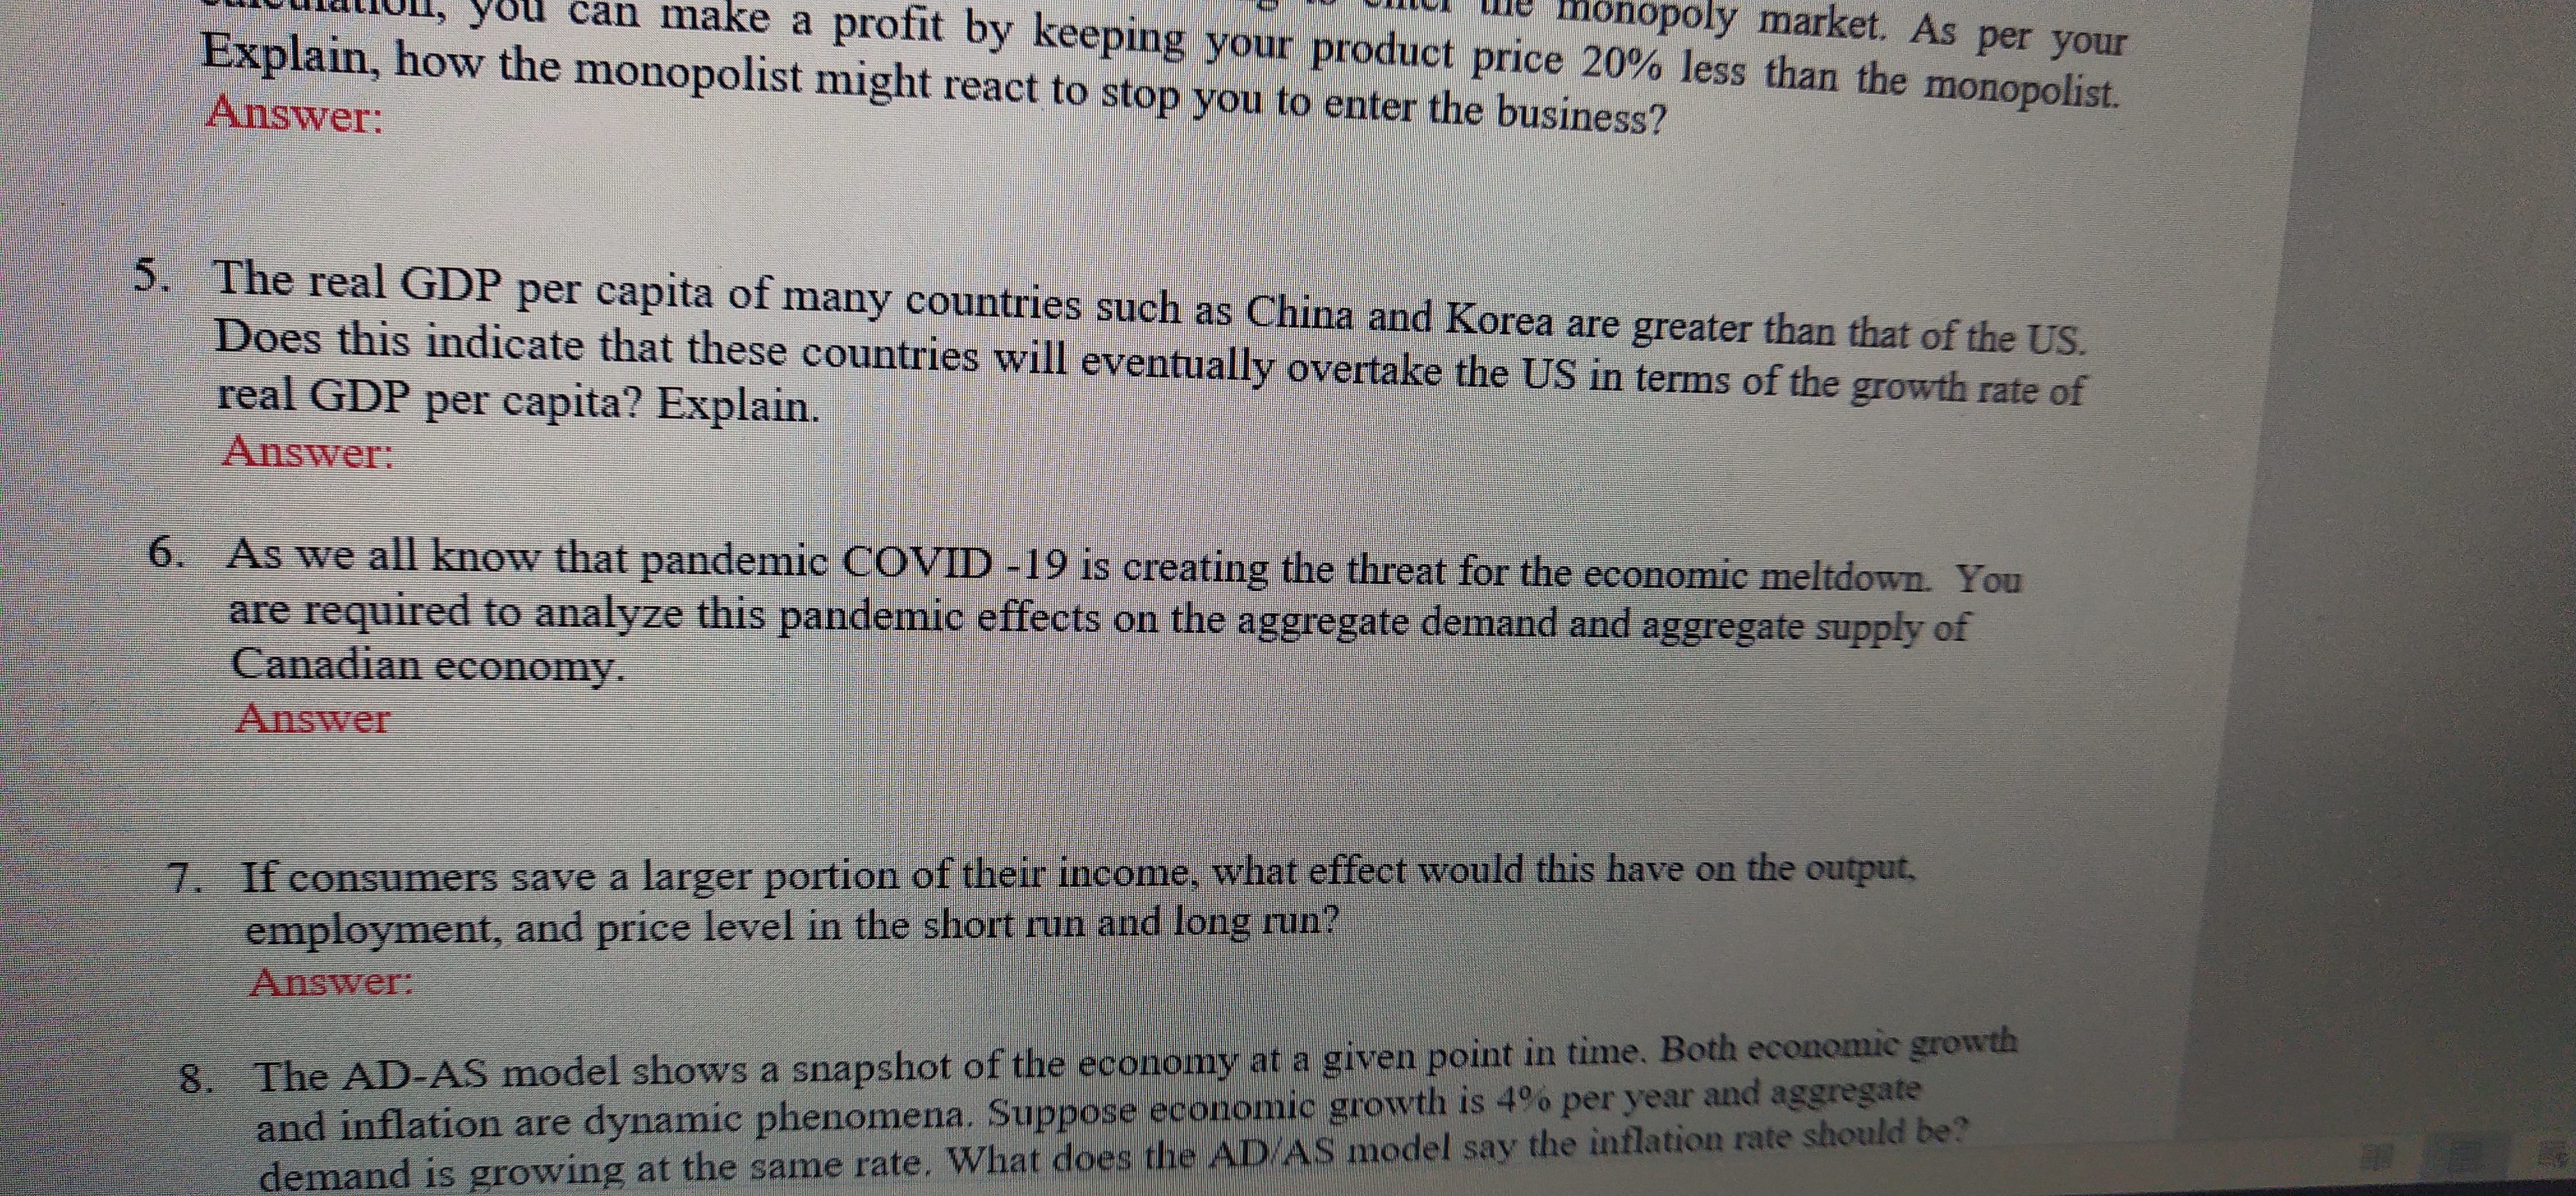
ques6

6.
The covid 19 is a pandemic which spread like a wildfire in the world economy. Even though the viral disease started in China, it spread to other countries like a wild wind. The US economy, European countries, central Asian countries etc are very much affected by the Covid 19 pandemic. The pandemic had caused many economical issues along with the health of the people.
The covid 19 created a demand side shock to the economy. As people were in panic of the fast paced spread of the disease, they started to demand more goods and services in the economy to stock for their future needs. People expected the quarantine period and started to stock the goods and commodities that are needed to meet the quarantine period. This created the demand shock in the economy. The fear of people about the disease caused the production to shrink in the economy which leads to the supply side shocks in the economy. the supply curve shifts to the left whereas the demand curve shifts to the right.
Step by stepSolved in 3 steps

- 9. Find Gross Value Added at Market Price. Items (? in lakhs) ) Depreciation (ii) Net Change in Stocks 20 Domestic Sales 200 (ii) (-) 10 (iv) Exports 10 smis (v) Single Use Producer Goods 120arrow_forwardIncome (Y) Money Supply (X) 116652 42011 120392 43313 124572 44808 132624 49243 139656 50094 148583 52117 150164 54253 153560 56512 157328 59243 161740 60783 168732 65173 176549 66338 182744 68694 190172 72238 191592 74544 195600 77300 201204 80021 204160 83482 212468 85868 214712 87911arrow_forwardUnder each of the titles in the table, AROC, ROC, AROC of ROC, 2nd ROC write the correct units for that calculation at the top of the column of values. Use the information from the two columns ROC and 2nd ROC in the table to answer the following questions about the population of people in Boise over the last 110 years.arrow_forward
- 1. Assume that a survey of households revealed that the non-institutional population 16 years and older is 250 million. Of that group, 100 million are working full-time and 50 million are working part-time. 15 million of the part-time workers said that they would prefer to be working full-time while the other 35 million prefer to be working part-time. Of the people who are not working, 11 million said that they want to work. All 11 million had either gone to a job interview or submitted a resume during the last year, but only 5 million had done so during the past month. Given this information, find the a. unemployment rate b. labor force participation rate c. u6 measure of labor utilizationarrow_forwardQ3: Without doing additional calculations, explain what would happen to the shape of the Lorenz curve and inequality in 2012 if households in and below the 15th percentile received cash transfers from the government.arrow_forwardWhat are the differences between national income, personal income, and disposable personal income? Note:- Please avoid using ChatGPT and refrain from providing handwritten solutions; otherwise, I will definitely give a downvote. Also, be mindful of plagiarism. Answer completely and accurate answer. Rest assured, you will receive an upvote if the answer is accurate.arrow_forward
- 6) The value of 100 South Korean Won (KRW) against the Japanese Yen (JPY) rose from9.7730 in May 2014 to 11.1710 on May 1, 2015. What was the percentage change inits value?arrow_forward18arrow_forward2007. 2. The data below shows the number of births, deaths, emigration and immigration for a countly m 200 Births 10,000 Deaths 3,000 Emigration 4,000 Immigration 7,000 If the total population at the beginning of the year was 104,000, calculate the (a) total population at the end of the year. (b) percentage increase in population for the year. (c) birth rate. (d) death rate. (e) net migration. (f) natural growth rate. 9.arrow_forward
- quarter and years Quarter1 2015 Quarter2 Quarter3|Quarter4 Quarter1 Quarter2 Quarter3 Quarter4 Quarter1 Quarter2 Quarter3 Quarter4 2015 Unit 2015 2015 2016 2016 2016 2016 2017 2017 2017 Description $ million Data Category and Component 2017 27.748 27.938 31.873 30.435 26.157 25.806 29.337 27.748 27.938 31.873 30.435 Agriculture $ milion 32.141 29.598 28.073 31.514 33.489 33.727 32.686 32.141 29.598 28.073 31.514 Mining and Quarrying Manufacturing $ milion 70.892 74.946 76.020 77.940 73.899 77.680 79.324 70.892 74.946 76.020 77.940 $ milion 7.522 7.977 8.095 8.116 7.903 8.318 8.621 8.641 8.315 8.738 9.115 9.208 Blectricity, Gas and Water $ million 16.659 16.041 17.179 16.673 17.655 16.971 18.166 16.659 16.041 17.179 16.673 Construction Wholesale and Retal Trade, Accommodation and Restaurants $ mion 51.264 51.984 56.305 60.687 55.180 56.232 60.976 65.920 60.720 62.578 67.437 72.322 Transport, Storage and Communication $ milion 25.163 25.772 26.539 26.887 27.287 28.059 28.593 29.026…arrow_forwardIf a charity is done to foreign country then this transaction will be recorded in which account of the balance of payment accounts? Please be brief. I need answer in not more than 4 linesarrow_forwardDerive TU Schedule from MU Schedule. Amount Consumed MU (units) (utils) 14 12 3 10 4 6arrow_forward

 Principles of Economics (12th Edition)EconomicsISBN:9780134078779Author:Karl E. Case, Ray C. Fair, Sharon E. OsterPublisher:PEARSON
 Engineering Economy (17th Edition)EconomicsISBN:9780134870069Author:William G. Sullivan, Elin M. Wicks, C. Patrick KoellingPublisher:PEARSON
 Principles of Economics (MindTap Course List)EconomicsISBN:9781305585126Author:N. Gregory MankiwPublisher:Cengage Learning
 Managerial Economics: A Problem Solving ApproachEconomicsISBN:9781337106665Author:Luke M. Froeb, Brian T. McCann, Michael R. Ward, Mike ShorPublisher:Cengage Learning
 Managerial Economics & Business Strategy (Mcgraw-...EconomicsISBN:9781259290619Author:Michael Baye, Jeff PrincePublisher:McGraw-Hill Education


