
MATLAB: An Introduction with Applications
6th Edition
ISBN: 9781119256830
Author: Amos Gilat
Publisher: John Wiley & Sons Inc
expand_more
expand_more
format_list_bulleted
Related questions
Question
Delivery service A company must decide which of two
delivery services it will contract with. During a recent
trial period, the company shipped numerous packages
with each service and kept track of how often deliveries
did not arrive on time. Here are the results:a) Compare the two services’ overall percentage of late
deliveries.
b) On the basis of the results in part a, the company has
decided to hire Pack Rats. Do you agree that Pack Rats
delivers on time more often? Explain.
c) The results here are an instance of what
phenomenon?a
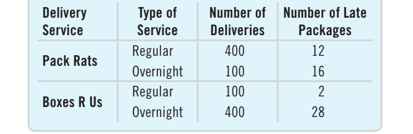

Transcribed Image Text:Delivery
Service
Туре of
Service
Number of Number of Late
Deliveries
Packages
Regular
400
12
Pack Rats
Overnight
100
16
Regular
100
Boxes R Us
Overnight
400
28
Expert Solution
This question has been solved!
Explore an expertly crafted, step-by-step solution for a thorough understanding of key concepts.

This is a popular solution

Trending nowThis is a popular solution!

Step by stepSolved in 3 steps with 5 images

Knowledge Booster


Learn more about
Need a deep-dive on the concept behind this application? Look no further. Learn more about this topic, statistics and related others by exploring similar questions and additional content below.Similar questions
- I need help with number 8, 4, and 5. Thank you so much :)arrow_forwardAn experiment to determine the most effective way to teach safety principles applied four different teaching methods. Some employees were given programmed instruction booklets and worked through the course at their own pace. Other employees attended lectures. A third group watched a television presentation, and a fourth group was divided into small discussion groups. A high of 10 was possible. A sample of five tests was selected from each group. The test grade results were: Sample Number Programmed Instruction Lecture TV Group Discussion 1 6 8 7 8 2 7 5 9 5 3 6 8 6 6 4 5 6 8 6 5 6 8 5 5 At the 0.01 level, what is the critical value? Multiple Choice 1.00 1.96 3.24 5.29arrow_forwardHow does an observed sample mean qualify as a rare outcome?arrow_forward
- Human blood is classified by the presence or absence of three main antigens (A, B, and Rh). When a blood specimen is typed, the presence of the A and/or B antigen is indicated by listing the letter A and/or the letter B. If neither the A nor the B antigen is present, the letter O is used.The following table gives the percent of a country's population having each of the eight possible blood types in the sample space. Note that the presence or absence of the Rh antigen is indicated by the symbols + or −, respectively. Blood Types A+ A− B+ B− AB+ AB− O+ O− Percent 35.7 6.1 8.5 1.5 3.4 0.8 37.4 6.6 (a) What is the probability that a person selected at random from the population has a blood type that is type AB given that the person is Rh+? (Round your answer to two decimal places.)(b) What is the probability that a person selected at random from the population has a blood type that is Rh− given that the person is type O? (Round your answer to two decimal places.)arrow_forwardThe table below shows the auto insurance quotes for two leading companies for a sample of 15 families. Assume the populations SDs are similar, but unknown. The President of the American Insurance Institute wants to compare the yearly costs of such insurance offered by the two companies. At the 0.10 level of significance, can we conclude that there is a difference in the amounts quoted? Families Southern Car American Mutual ($) ($) 1 2090 1610 2 1683 1247 3 1402 2327 4 1830 1367 5 930 1461 6 697 1789 7 1741 1621 8 1129 1914 9 1018 1956 10 1881 1772 11 1571 1375 12 874 1527 13 1579 1767 14 1577 1636 15 860 1188arrow_forwardHuman blood is classified by the presence or absence of three main antigens (A, B, and Rh). When a blood specimen is typed, the presence of the A and/or B antigen is indicated by listing the letter A and/or the letter B. If neither the A nor the B antigen is present, the letter O is used. The following table gives the percent of a country's population having each of the eight possible blood types in the sample space. Note that the presence or absence of the Rh antigen is indicated by the symbols + or -, respectively. 0 Blood Types Percent A+ A 6.3 35.7 B+ B 8.5 1.5 AB+ AB 3.4 0.8 0+ 37.2 (a) What is the probability that a person selected at random from the population has a blood type that is type A given that the person is Rh? (Round your answer to two decimal places.) 6.6 (b) What is the probability that a person selected at random from the population has a blood type that is Rh* given that the person is type B? (Round your answer to two decimal places.)arrow_forward
- Human blood is classified by the presence or absence of three main antigens (A, B, and Rh). When a blood specimen is typed, the presence of the A and/or B antigen is indicated by listing the letter A and/or the letter B. If neither the A nor the B antigen is present, the letter O is used.The following table gives the percent of a country's population having each of the eight possible blood types in the sample space. Note that the presence or absence of the Rh antigen is indicated by the symbols + or −, respectively. Blood Types A+ A− B+ B− AB+ AB− O+ O− Percent 35.7 6.1 9.5 1.5 3.4 0.8 37.4 5.6 (a) What is the probability that a person selected at random from the population has a blood type that is type A given that the person is Rh−? (Round your answer to two decimal places.)(b) What is the probability that a person selected at random from the population has a blood type that is Rh+ given that the person is type B? (Round your answer to two decimal places.)arrow_forwardA foundation asked each person in a representative sample of high school students and in a representative sample of high school teachers which of the rights guaranteed by the First Amendment they thought was the most important. Suppose that the sample size for each sample was 1,000. Data consistent with summary values from the study are summarized in the accompanying table. Students = Teachers Freedom of Speech 658 400 USE SALT Most Important First Amendment Right Freedom of Religion Freedom to Peacefully Assemble Freedom of the Press 30 55 245 420 20 55 Freedom to Petition the Government 47 70 (a) Carry out a hypothesis test to determine if there is convincing evidence that the proportions falling into the five First Amendment rights categories are not the same for teachers and students. Use a significance level of a = 0.01. Calculate the test statistic. (Round your answer to two decimal places.) x²= Use technology to calculate the P-value. (Round your answer to four decimal places.)…arrow_forward
arrow_back_ios
arrow_forward_ios
Recommended textbooks for you
- MATLAB: An Introduction with ApplicationsStatisticsISBN:9781119256830Author:Amos GilatPublisher:John Wiley & Sons Inc
 Probability and Statistics for Engineering and th...StatisticsISBN:9781305251809Author:Jay L. DevorePublisher:Cengage Learning
 Statistics for The Behavioral Sciences (MindTap C...StatisticsISBN:9781305504912Author:Frederick J Gravetter, Larry B. WallnauPublisher:Cengage Learning
  Elementary Statistics: Picturing the World (7th E...StatisticsISBN:9780134683416Author:Ron Larson, Betsy FarberPublisher:PEARSON
 The Basic Practice of StatisticsStatisticsISBN:9781319042578Author:David S. Moore, William I. Notz, Michael A. FlignerPublisher:W. H. Freeman
 Introduction to the Practice of StatisticsStatisticsISBN:9781319013387Author:David S. Moore, George P. McCabe, Bruce A. CraigPublisher:W. H. Freeman
MATLAB: An Introduction with Applications
Statistics
ISBN:9781119256830
Author:Amos Gilat
Publisher:John Wiley & Sons Inc
Probability and Statistics for Engineering and th...
Statistics
ISBN:9781305251809
Author:Jay L. Devore
Publisher:Cengage Learning
Statistics for The Behavioral Sciences (MindTap C...
Statistics
ISBN:9781305504912
Author:Frederick J Gravetter, Larry B. Wallnau
Publisher:Cengage Learning
Elementary Statistics: Picturing the World (7th E...
Statistics
ISBN:9780134683416
Author:Ron Larson, Betsy Farber
Publisher:PEARSON
The Basic Practice of Statistics
Statistics
ISBN:9781319042578
Author:David S. Moore, William I. Notz, Michael A. Fligner
Publisher:W. H. Freeman
Introduction to the Practice of Statistics
Statistics
ISBN:9781319013387
Author:David S. Moore, George P. McCabe, Bruce A. Craig
Publisher:W. H. Freeman