
MATLAB: An Introduction with Applications
6th Edition
ISBN: 9781119256830
Author: Amos Gilat
Publisher: John Wiley & Sons Inc
expand_more
expand_more
format_list_bulleted
Related questions
Question
Data was collected to explain an employee’s annual income raise (expressed in $’s) based on the employee’s rating (on a scale of 1-20)
Based on the regression results, answer the following questions
g) What is the effect on “raise” of getting a 1 point higher rating?
h) What is the 95% confidence interval for the coefficient of rating?
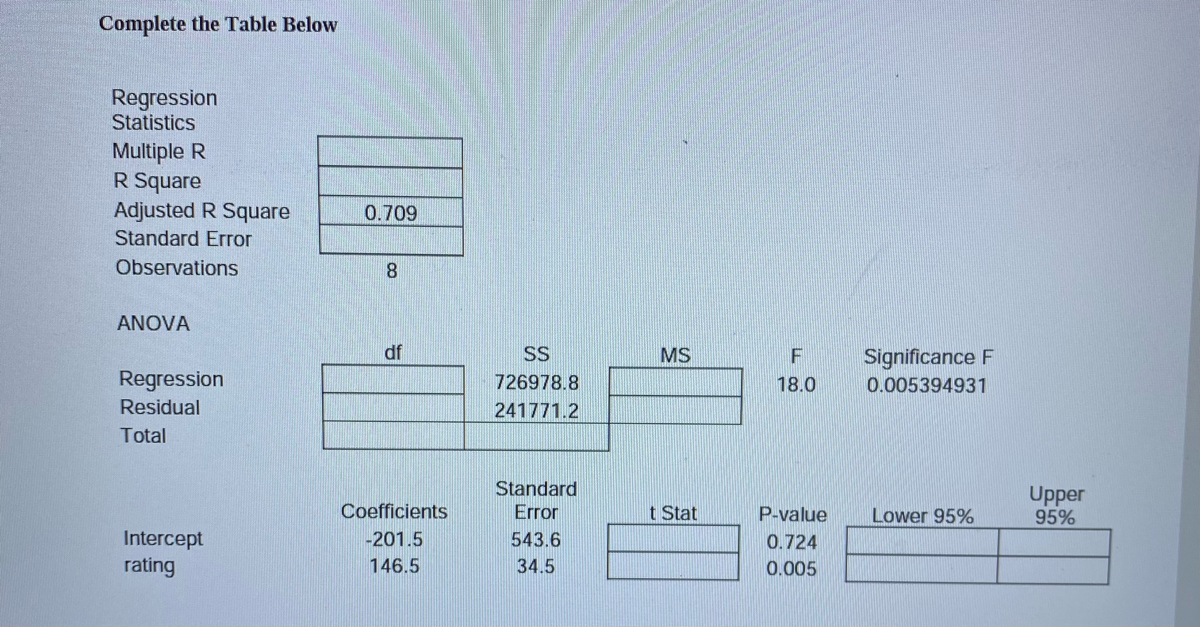

Transcribed Image Text:Complete the Table Below
Regression
Statistics
Multiple R
R Square
Adjusted R Square
0.709
Standard Error
Observations
8.
ANOVA
df
SS
MS
F
Significance F
Regression
726978.8
18.0
0.005394931
Residual
241771.2
Total
Standard
Upper
95%
Coefficients
Error
t Stat
P-value
Lower 95%
Intercept
rating
-201.5
543.6
0.724
146.5
34.5
0.005
Expert Solution
This question has been solved!
Explore an expertly crafted, step-by-step solution for a thorough understanding of key concepts.

Step by stepSolved in 2 steps

Knowledge Booster

Similar questions
- To determine if the number of hours of exercise per week is significantly correlated with quality of sleep, you measure these values on 20 participants. What is the critical value you need in order to determine if your correlation coefficient is significant at p=0.05. Use 3 decimal placesarrow_forwardHi, I am having trouble finding the P-value for this problem. Could you please explain step by step how will I figure out the P-value? Thanks.arrow_forwardListed below are altitudes (thousands of feet) and outside air temperatures (°F) recorded during a flight. Find the (a) explained variation, (b) unexplained variation, and (c) indicated prediction interval. There is sufficient evidence to support a claim of a linear correlation, so it is reasonable to use the regression equation when making predictions. For the prediction interval, use a 95% confidence level with the altitude of 6327 ft (or 6.327 thousand feet). Altitude Temperature a. Find the explained variation. (Round to two decimal places as needed.) 2 55 8 40 13 25 20 - 3 28 - 26 31 - 41 34 - 53arrow_forward
- A researcher at a large company has collected data on the beginning salary and current salary of 50 randomly selected employees. The correlation between the data sets is r = 0.912. The summary statistics from the data collected are shown bellow: Beginning Salary Ending Salary Mean x¯=56,340 y¯=82,070 Standard deviation Sx = 5,470 Sy = 7,800 Use a complete sentence to describe the strength and direction of the linear relationship between beginning salary and current salary. Find the equation of the least-squares regression line. (Round to two decimal places)arrow_forwardExercise 6. Regression Fallacy. Historically, scores on the two midterms had a correlation of 0.48. Suppose that Jeri scored 2.1 standard deviations below the mean on the first midterm. (a) How many standard deviations [above or below?] the mean would you predict for her second midterm?arrow_forwardReport a 95% confidence interval for the slope coefficient. What is the left limit of the interval? Round to four decimals.arrow_forward
- What is a covariate?arrow_forwardThe value of Beta with hat on top =2.8 is a statistic. True or false. Explain.arrow_forwardConsider a certain data set on shoulder girth and height of a group of individuals. The mean shoulder girth is 107.20 cm with a standard deviation of 10.37 cm. The mean height is 171.14 cm with a standard deviation of 9.41 cm. The correlation between height and shoulder girth is 0.67. Calculate R2 of the regression line for predicting height from shoulder girth, and interpret it in the context of the application.arrow_forward
- For a given set of x and y data values, assume that the regression model assumptions are valid and that a 90% confidence interval for ₁ is given by (-2.2, -0.1). Which of the following statements are true? i) At a = 0.10, there is a significant linear relationship between x and y. ii) In the scatterplot of x and y, the values of y tend to decrease as the values of x increase. iii) Based on this confidence interval, we would reject the null hypothesis of no linear relationship at any significance level a ≤ 0.1. Select one: a. i) O b. i) and ii) O c. ii) d. i), ii), and iii)arrow_forwardIf the correlation coefficient between hours spent studying and exam performance is -0.24, then what percent of the variability in the hours spent variable is attributable to the exam performance variable? Round to one decimal place.arrow_forward
arrow_back_ios
arrow_forward_ios
Recommended textbooks for you
- MATLAB: An Introduction with ApplicationsStatisticsISBN:9781119256830Author:Amos GilatPublisher:John Wiley & Sons Inc
 Probability and Statistics for Engineering and th...StatisticsISBN:9781305251809Author:Jay L. DevorePublisher:Cengage Learning
 Statistics for The Behavioral Sciences (MindTap C...StatisticsISBN:9781305504912Author:Frederick J Gravetter, Larry B. WallnauPublisher:Cengage Learning
  Elementary Statistics: Picturing the World (7th E...StatisticsISBN:9780134683416Author:Ron Larson, Betsy FarberPublisher:PEARSON
 The Basic Practice of StatisticsStatisticsISBN:9781319042578Author:David S. Moore, William I. Notz, Michael A. FlignerPublisher:W. H. Freeman
 Introduction to the Practice of StatisticsStatisticsISBN:9781319013387Author:David S. Moore, George P. McCabe, Bruce A. CraigPublisher:W. H. Freeman
MATLAB: An Introduction with Applications
Statistics
ISBN:9781119256830
Author:Amos Gilat
Publisher:John Wiley & Sons Inc
Probability and Statistics for Engineering and th...
Statistics
ISBN:9781305251809
Author:Jay L. Devore
Publisher:Cengage Learning
Statistics for The Behavioral Sciences (MindTap C...
Statistics
ISBN:9781305504912
Author:Frederick J Gravetter, Larry B. Wallnau
Publisher:Cengage Learning
Elementary Statistics: Picturing the World (7th E...
Statistics
ISBN:9780134683416
Author:Ron Larson, Betsy Farber
Publisher:PEARSON
The Basic Practice of Statistics
Statistics
ISBN:9781319042578
Author:David S. Moore, William I. Notz, Michael A. Fligner
Publisher:W. H. Freeman
Introduction to the Practice of Statistics
Statistics
ISBN:9781319013387
Author:David S. Moore, George P. McCabe, Bruce A. Craig
Publisher:W. H. Freeman