MATLAB: An Introduction with Applications
6th Edition
ISBN: 9781119256830
Author: Amos Gilat
Publisher: John Wiley & Sons Inc
expand_more
expand_more
format_list_bulleted
Topic Video
Question

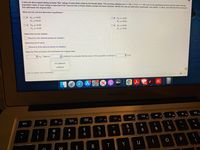
Transcribed Image Text:A data set about speed dating includes "like" ratings of male dates made by the female dates. The summary statistics are n= 194, x= 5.81, s= 1.95. Use a 0.05 significance level to test the claim that the
population mean of such ratings is less than 6.00. Assume that a simple random sample has been selected. Identify the null and alternative hypotheses, test statistic, P-value, and state the final conclusion
that addresses the original claim.
What are the null and altemative hypotheses?
O A. Ho: H=6.00
H:H#6.00
O B. Ho: µ<6.00
H,: p>6.00
OC. Ho: H = 6.00
O D. Ho: u= 6.00
H:>6.00
H: u<6.00
Determine the test statistic.
|(Round to two decimal places as needed.)
Determine the P-value.
|(Round to three decimal places as needed.)
State the final conclusion that addresses the original claim.
V Ho. There is
5 evidence to conclude that the mean of the population of ratings is
V 6.00.
not sufficient
sufficient
Click to select your answer(s).
otv
MacBook Air
FIZ
FI
F9
F10
FB
F7
000 FA
FS
F6
esc
F2
F3
F1
*
&
#
$
%
9
6
7
8
3
4
5
P
R
Y U
W
E
© N

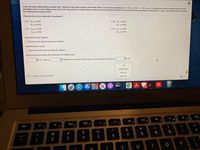
Transcribed Image Text:A data set about speed dating includes "like" ratings of male dates made by the female dates. The summary statistics are n= 194, x= 5.81, s= 1.95. Use a 0.05 significance level to test the claim that the
population mean of such ratings
that addresses the original claim.
less than 6.00. Assume that a simple random sample has been selected. Identify the null and alternative hypotheses, test statistic, P-value, and state the final conclusion
What are the null and altemative hypotheses?
O A. Ho: H= 6.00
O B. Ho: H<6.00
H1:p> 6.00
H:p#6.00
OC. Ho: H=6.00
O D. Ho: H=6.00
H: p> 6.00
Hy: H<6.00
Determine the test statistic.
(Round to two decimal places as needed.)
Determine the P-value.
O (Round to three decimal places as needed.)
State the final conclusion that addresses the original claim.
V Ho. There is
V evidence to conclude that the mean of the population of ratings is
V 6.00.
not
greater than
equal to
Click to select your answer(s).
less than
étv
MacBook Air
FI
F10
14
F7
F9
心.
F6
esc
F3
F2
$
%
&
@
#
7
8
9
2
3
4
5
6
+ ||
Expert Solution
This question has been solved!
Explore an expertly crafted, step-by-step solution for a thorough understanding of key concepts.
Step by stepSolved in 2 steps

Knowledge Booster
Learn more about
Need a deep-dive on the concept behind this application? Look no further. Learn more about this topic, statistics and related others by exploring similar questions and additional content below.Similar questions
- P value =???arrow_forward12) Please provide a correct answer with a full method explanation and do not copy and past from other similar questions.arrow_forwardpoll used a sample of 100 randomly selected car owners. Within the sample, the mean time of ownership for a single car was 7.18 years with a standard deviation of 3.37 years. Test the claim by the owner of a large dealership that the mean time of ownership for all cars is less than 7.5 years. Use a 0.05 significance level. Find the Z score and P value and if left-tailed or right-tailed. Also to reject or not too.arrow_forward
- The average retirement age in America is 66 years old. Do small business owners retire at an older average age? The data below shows the results of a survey of small business owners who have recently retired. Assume that the distribution of the population is normal. 63, 74, 59, 64, 74, 60, 71, 67, 65, 70, 63 What can be concluded at the the � = 0.05 level of significance level of significance? For this study, we should use The null and alternative hypotheses would be: �0: �1: The test statistic = (please show your answer to 3 decimal places.) The p-value = (Please show your answer to 4 decimal places.) The p-value is � Based on this, we should the null hypothesis. Thus, the final conclusion is that ... The data suggest the populaton mean is significantly older than 66 at � = 0.05, so there is sufficient evidence to conclude that the population mean retirement age for small business owners is older than 66. The data suggest…arrow_forwardA clinical researcher performs a clinical trial on 12 patients to determine whether a drug treatment has an effect on serum glucose. The sample mean glucose of the patients before and after the treatment are summarized in the following table. The sample standard deviation of the differences was 6. Sample mean glucose (mg/dL) Before treatment 114 After treatment 108 What type of hypothesis test should be performed?Select: Left-tailed z-test Unpaired t-test Two-tailed z-test Paired t-test What is the test statistic? What is the number of degrees of freedom? Does sufficient evidence exist to support the claim that the drug treatment has an effect on serum glucose at the α=0.05 significance level? Select: _____Yes OR _____Noarrow_forwardPlease answer FULL questionarrow_forward
- Perform a hypothesis test to determine whether there is a difference in the mean attendance of teams between the two groups created in Part F. Use a 0.05 level of significance in your testing procedures. Hint: When calculating your pooled sample variance and your test statistic, assume the Top 10 data is sample 1 and the Bottom 10 data is sample 2. Decision Rule -t < or t > = REJECT H0 Value of Pooled Sample Variances Value of test statistic Decision: enter Reject or Do Not Reject Is there a difference in the mean attendance between the two groups assuming a 0.05 level of significance? Enter Yes or No. Another variable that can impact attendance is the team's win-loss record. Teams that are winning more games are thought to have increased attendance as fans prefer to see their home team "win" rather than "lose" (although for some teams such as the Chicago Cubs, this is not always an established relationship!). Create 2 samples…arrow_forwardUse a 0.05 significance level to test the claim that males and females have the same mean BMI Male BMI n=80 * = 26.3 s = 5.4 Female BMI n=61 I = 28.4 s = 7.4arrow_forwardSalaries of 34 college graduates who took a statistics course in college have a mean, x, of $67,400. Assuming a standard deviation, o, of $15,845, construct a 90% confidence interval for estimating the population mean u.arrow_forward
- The summary statistics are n=85, x=3.93, s=0.63. Use a 0.01 significance level to test the claim that the population of student course evaluations has a mean equal to 4.00. identify null/ alt hypothesis, test statistic, P- value, and state final conclusion that addresses the original claimarrow_forwardHelp pleasearrow_forwardA pipes manufacturer makes pipes with a length that is supposed to be 12 inches. A quality control technician sampled 35 pipes and found that the sample mean length was 12.05 inches and the sample standard deviation was 0.13 inches. The technician claims that the mean pipe length is not 12 inches. What type of hypothesis test should be performed? Two-tailed t-test Two-tailed z-test Left tailed t-test Left tailed z-test What is the test statistic? What is the number of degrees of freedom? Does sufficient evidence exist at the α=0.01 significance level to support the technician's claim? Yes or Noarrow_forward
arrow_back_ios
SEE MORE QUESTIONS
arrow_forward_ios
Recommended textbooks for you
 MATLAB: An Introduction with ApplicationsStatisticsISBN:9781119256830Author:Amos GilatPublisher:John Wiley & Sons Inc
 Probability and Statistics for Engineering and th...StatisticsISBN:9781305251809Author:Jay L. DevorePublisher:Cengage Learning
 Statistics for The Behavioral Sciences (MindTap C...StatisticsISBN:9781305504912Author:Frederick J Gravetter, Larry B. WallnauPublisher:Cengage Learning
 Elementary Statistics: Picturing the World (7th E...StatisticsISBN:9780134683416Author:Ron Larson, Betsy FarberPublisher:PEARSON
 The Basic Practice of StatisticsStatisticsISBN:9781319042578Author:David S. Moore, William I. Notz, Michael A. FlignerPublisher:W. H. Freeman
 Introduction to the Practice of StatisticsStatisticsISBN:9781319013387Author:David S. Moore, George P. McCabe, Bruce A. CraigPublisher:W. H. Freeman

MATLAB: An Introduction with Applications
Statistics
ISBN:9781119256830
Author:Amos Gilat
Publisher:John Wiley & Sons Inc

Probability and Statistics for Engineering and th...
Statistics
ISBN:9781305251809
Author:Jay L. Devore
Publisher:Cengage Learning

Statistics for The Behavioral Sciences (MindTap C...
Statistics
ISBN:9781305504912
Author:Frederick J Gravetter, Larry B. Wallnau
Publisher:Cengage Learning

Elementary Statistics: Picturing the World (7th E...
Statistics
ISBN:9780134683416
Author:Ron Larson, Betsy Farber
Publisher:PEARSON

The Basic Practice of Statistics
Statistics
ISBN:9781319042578
Author:David S. Moore, William I. Notz, Michael A. Fligner
Publisher:W. H. Freeman

Introduction to the Practice of Statistics
Statistics
ISBN:9781319013387
Author:David S. Moore, George P. McCabe, Bruce A. Craig
Publisher:W. H. Freeman